
In terms of diseases, demographics, and infrastructure, the world around us is constantly evolving. For those involved in the medical and healthcare fields, knowing how the communities and their populations change is vital to understanding disease burden and associated factors.
The need for reliable databases and data dissemination is increasing. Whether for managing chronic disease, allocating medical and health resources, expanding into population health, or examining how medical education can be expanded and where, multitudes of data and sources are available to inform and guide decision making. This information is crucial to how one shapes healthcare policies affecting the health of millions.
A notable example of such a database and dissemination product is the Johns Hopkins COVID-19 Dashboard. During the pandemic, this dashboard provided spatial visualizations of the spread and containment of COVID, which had not been tracked geographically, nor in real time.(1) The dashboard stopped collecting data on March 10, 2023, yet remains up and ready to be used again should the need arise.(2, 3)
Other organizations such as the Centers for Disease Control and Prevention (CDC) and the World Health Organization (WHO) also created information dashboards related to COVID-19 and maintain a variety of databases and information related to broad health topics such as outbreaks, environmental justice, heat and health, and health emergencies.(4–6)
RESOURCES TO GUIDE HEALTHCARE DECISIONS
Featured here are several resources for physician leaders to use with confidence to inform their work. The data types within these resources include location and number of health facilities, workforce projections, demographic data, spatial data, and medical education data. These relevant resources can guide and inform the extent of healthcare and medical issues present in the United States.
U.S. Census Bureau
The overall goal of the U.S. Census Bureau is to provide current facts and figures about the United States’ people, places, and economy.(7) These data can be sorted and filtered within the search tool on the Census Bureau Data website, (data.census.gov). This is the Census Bureau’s primary data dissemination tool. Additionally, a user can use the tool to create specific data tables and maps.(8) Data can be found for various geographic levels such as state, county, ZIP code, and census tract.
One of the most valuable Census Bureau data surveys is the American Community Survey (ACS). The ACS provides one-year and five-year estimates on a variety of demographic and economic variables as well as certain health-related variables for locations and sections of the U.S. population. These data can be exported for use in external statistical software and other analysis platforms.(9) Figure 1 illustrates an ACS data query for disability characteristics in Hennepin County, Minnesota, for the five-year estimates.

Figure 1. ACS Data Query for Disability Characteristics in Hennepin County, Minnesota
HRSA Data Warehouse
To support one aspect of the Health Resources and Service Administration’s (HRSA) mission to advance equitable healthcare in the United States, HRSA maintains a public online data warehouse of data, reports, maps, and dashboards about HRSA healthcare programs.(10)
Examples of HRSA data include health professional shortage areas (HPSAs), medically underserved areas/populations (MUA/Ps), HRSA grants awarded by state and program area, and Centers for Medicare & Medicaid Services (CMS) provider of service (POS) files, which include the location of many types of healthcare facilities. The data warehouse also integrates data from several external sources, such as the U.S. Census Bureau, which provide additional context to the related health data.(11)
The HRSA data can be viewed through its online tools, dashboards, and mapping tools; by downloading copies of the data from data queries; or as full data sets provided to HRSA. The data formats can be suited for specific platforms such as Excel, ASCII, and SAS, as well as shapefiles for use in GIS (geographic information systems) software.(11) Figure 2 illustrates a data query for hospitals located in North Dakota.
The HRSA warehouse website reveals additional information, such as the individual sources for its data sets and their refresh rates. While some data such as HPSAs are refreshed daily, other data sets are refreshed monthly, annually, or as needed.

Figure 2. HRSA Data Warehouse Data Query Example
CDC Data Assets
The Centers for Disease Control and Prevention (CDC) maintains a variety of useful data assets such as its own data catalog, the National Center for Health Statistics (NCHS), and the CDC WONDER (Wide-ranging Online Data for Epidemiological Research).
As of October 2023, the CDC data catalog consists of 1,576 data sets.(12) CDC data sets can be searched by key word(s) or can be browsed through various categories such as disability and health, health statistics, chronic diseases, and public health surveillance. NCHS data are part of CDC data catalog. Data across the CDC resources are available at many geographic levels, although not lower than the county level and depending on the data set. Some data across the whole of CDC may be suppressed to protect privacy.
The NCHS website offers a variety of raw data, surveys, and records that provide information on health-related topics. Examples include CMS Medicare/Medicaid Enrollment and Claims Files, the National Home and Hospice Care Survey, and the National Vital Statistics System.(13) Certain data from the NCHS can also be accessed through its Research Data Center, which provides secured access to Department of Health and Human Services (HHS) data that may be more sensitive in nature, such as responses to surveys for which response rates are low.(14)
The CDC WONDER database offers the ability to perform an ad-hoc query of public health data and reports published by the CDC about public health concerns. WONDER can also query numerical data in the CDC’s information systems and export subsequent summary statistics. Topics within the WONDER database include chronic conditions, occupational health, communicable diseases, environmental health practices, and prevention.(15) Figure 3 shows an example of performing a WONDER data query for the underlying cause of death.

Figure 3. CDC WONDER Data Query Example
The Association of American Medical Colleges (AAMC) and The American Association of Colleges of Osteopathic Medicine (AACOM)
AAMC and AACOM curate and maintain databases about American schools of medicine, their applicants, and matriculants. Information such as place of origin, specialty, salaries, and basic demographics can be found within both associations’ databases. These data are also downloadable for use in external software.
The AAMC database offers not only student data, but also data on admissions, salaries, residencies, and medical school faculty. Data can be searched and filtered by data and topic. AAMC offers a data request feature so users can create a custom data report.(16) AACOM offers a similar database. Some of AACOM’s data are open access; certain analytic dashboards are member-only features. Access to AACOM analytics requires a dean’s approval.(17)
The Environmental Systems Research Institution (ESRI) Community Analyst
For those with GIS capacity in their organization, the Community Analyst is a web-based tool created by ESRI that integrates directly into the ArcGIS suite of products. Users can query and retrieve information on a specific socioeconomic area that they define, such as examining one’s city boundaries or county, state, or geographic region.(18) Sources for these data include the U.S. Census Bureau, the Bureau of Labor Statistics, and other private databases used to create indexes and indicators for use in the tool.(19)
A unique feature of the Community Analyst is the ability to define distance or driving times from a specific point and to assess the underlying socioeconomic data by the individual bands. As illustrated in Figure 4, users can specify exact times to or from a facility (in this case a hospital in Minnesota), set traffic attributes, and choose other specifications such as rural driving times, which account for travel on unimproved roads. Upon set up, the program will create banded zones based on the defined time delineations.
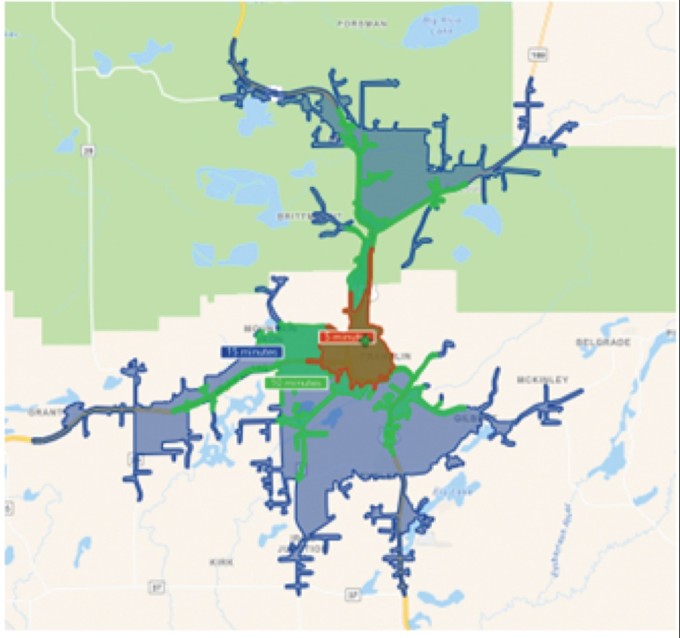
Figure 4. Examples of Analysis Bands at 5-, 10-, and 15-minute Drive Times
Once these bands of data are created, the user can click on the point to produce a variety of infographics, each of which is downloadable as an image, PDF, or Excel file. Figure 5 shows the healthcare and insurance infographic for a drive time of five minutes from the example hospital. Many other infographics such as basic demographics, economic profile, population growth, and several others are available. The ability to create a custom infographic also exists within this tool.

Figure 5. Healthcare and Insurance Infographic for 5-minute Drive-time Example
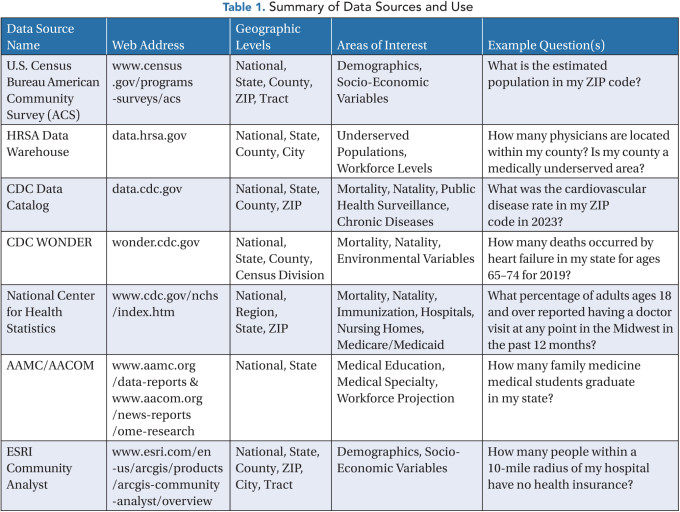
Table 1 summarizes the data sources and data tools discussed in this article, along with specific notations for areas of interests and geographic levels and examples of questions that could be answered.
CONCLUSION
A variety of available data resources can help physician leaders better understand population health issues. Until recently, acquiring, cleaning, verifying, and analyzing data required much more time and effort; today’s databases and tools are designed for reliability and ease-of-use. During the recent pandemic, geographic information systems and health databases delivered useful spatial data to understand health at a community, national, and international scale.
The databases featured here can be used to analyze healthcare, understand health workforce trends, and organize data in response to health crises. Each database can help physician leaders examine the relationships of geography, health equity, and population health.
As more databases develop and their features evolve, leaders and policymakers can devote more efforts from data management to informing interventions in the quest to advance health equity and population health with insights for better decision making.
References
Dong E, Du H, Gardner L. An Interactive Web-Based Dashboard To Track COVID-19 in Real Time. The Lancet Infect Dis. 2020;20(5):533–534. https://doi.org/10.1016/S1473-3099(20)30120-1
Torkington S. Johns Hopkins to Close Pioneering COVID-19 Tracker. World Economic Forum. March 9, 2023. https://www.weforum.org/agenda/2023/03/covid-tracker-closing-down-johns-hopkins
Johns Hopkins University of Medicine. COVID-19 Map FAQ. Johns Hopkins Coronavirus Resource Center. https://coronavirus.jhu.edu/map-faq
National Outbreak Reporting System (NORS) Dashboard. Centers for Disease Control and Prevention. https://wwwn.cdc.gov/norsdashboard
Tracking Dashboards. National Environmental Public Health Tracking. Centers for Disease Control and Prevention. August 31, 2021. https://www.cdc.gov/nceh/tracking/dashboards.htm
World Health Organization. WHO Health Emergency Dashboard. https://extranet.who.int/publicemergency
U.S. Census Bureau. What We Do. Census.gov. https://www.census.gov/about/what.html
U.S. Census Bureau. Census Bureau Data. https://data.census.gov
U.S. Census Bureau. American Community Survey (ACS). Census.gov. https://www.census.gov/programs-surveys/acs
Health Resources and Services Administration. Who We Are. hrsa.gov. https://www.hrsa.gov
Health Resources and Services Administration. HRSA Data Warehouse – Data Download. 2023. https://data.hrsa.gov
Centers for Disease Control and Prevention. Data.CDC.gov. Accessed November 20, 2023. https://data.cdc.gov
National Center for Health Statistics. Centers for Disease Control and Prevention. November 15, 2023. https://www.cdc.gov/nchs/index.htm
Research Data Center. RDC Homepage. April 18, 2023. https://www.cdc.gov/rdc/index.htm
Centers for Disease Control and Prevention. CDC WONDER. https://wonder.cdc.gov
American Association of Medical Colleges. Data & Reports. AAMC. https://www.aamc.org/data-reports
American Association of Colleges of Osteopathic Medicine. OME Research. aacom.org. https://www.aacom.org/news-reports/ome-research
ESRI. ArcGIS Community Analyst. Demographic Data & Planning Mapping Software. https://www.esri.com/en-us/arcgis/products/arcgis-community-analyst/overview
ESRI. United States—ESRI Demographics Regional Data. Documentation. https://doc.arcgis.com/en/esri-demographics/latest/regional-data/united-states.htm