
Abstract:
The purpose of our study was to compare performance between Medicare Advantage and stand-alone prescription drug plans on the two quality assurance measures of drug-disease interaction and drug-drug interaction for elderly heart failure beneficiaries. Performance on the drug-disease interaction measure appeared more problematic for stand-alone plan enrollees compared with Medicare Advantage plan enrollees. No statistical difference existed between the plans regarding drug-drug interactions. It appears there may be considerable room for more sophisticated use of disease profiling in the processing of drug claims. The provision of richer clinical data is an essential step to improving performance on the drug-disease interaction measure.
Introduction
Medicare Part D sponsors are responsible for ensuring that beneficiaries enrolled in their plans receive quality healthcare. Title 42 CFR Part 423, Subpart D establishes the requirements Part D sponsors must meet with regard to cost control and quality improvement. The regulation requires that Part D sponsors provide: (1) a drug utilization management program; (2) quality assurance measures and systems; and (3) a medication therapy management program for targeted beneficiaries. Quality assurance includes drug utilization review for screening potential drug therapy problems such as drug-disease and drug-drug interactions. For effective quality assurance, information for evaluation of performance as well as identification of areas for improvement is needed. Such information includes data on patient comorbidities that may impede the effectiveness of medications the patient is taking or produce an adverse reaction that is harmful to the patient.
A distinction exists between a Medicare Advantage prescription drug plan (MA-PDP) and a stand-alone prescription drug plan (PDP) regarding the robustness of information available. MA-PDPs have extensive information on patient comorbidities because they provide Medicare Part A and B services in addition to prescription drugs. MA-PDPs are required to report patient conditions to the Centers for Medicare & Medicaid Services (CMS) for purposes of determining payment rates. Having ready access to clinical information is particularly helpful when evaluating one’s performance on the quality assurance measure of drug-disease interaction because this metric requires prior knowledge of a patient’s diseases before performance (on the measure) can be optimal.
Comparatively, PDPs are less likely to have complete information on comorbidities because they do not provide acute care services. PDPs do receive previous years’ CMS’ Hierarchical Condition Category prescription (RxHCC) risk score data for current year enrollees, which addresses some disease groups. The risk score data do not identify recently diagnosed conditions. Otherwise, the information PDPs obtain may be limited to inferences drawn from drug claims. PDPs can also contact prescribers or beneficiaries directly in order to enrich the clinical information. However, as the intensity of these more active tactics increases, so does the expense to the PDP. A key quality assurance measure is the reduction of drug-disease interactions, and PDPs are hampered if they don’t have the appropriate clinical data.
In this study, we compare performance between MA-PDPs and PDPs on the two quality assurance measures of drug-disease interaction and drug-drug interaction for elderly beneficiaries with heart failure (HF). These two measures were chosen because each addresses a pertinent quality assurance concern with medication use. Beneficiaries with HF were selected because these individuals are at high risk for poor health outcomes, and a slight improvement in quality assurance will likely be of great benefit. The two quality assurance measures selected were commonly utilized during electronic claims adjudication. Of these two measures, we perceive that clinical information is most relevant to performance of the drug-disease interaction metric. However, it is currently unknown how much discrepancy exists on the performance of these measures between MA-PDPs and PDPs. It was our hypothesis that MA-PDPs will perform better than PDPs on the drug-disease interaction measure because they have better access to clinical data; MA-PDP performance on the remaining measure of drug-drug interaction will not be superior to that of PDP plans because reliance on clinical data for improved performance is less critical. Our study aim was to provide useful information to the Part D program for further policy consideration regarding quality assurance.
Methods
Data
Data were obtained from the Medicare Master Beneficiary Summary file, Medicare Part D prescription drug event (PDE) files, CMS’ Chronic Condition Data Warehouse, CMS’ Hierarchical Condition Category (CMS-HCC) prospective risk score model, CMS’ RxHCC model, Medicare Minimum Data Set (MDS) files, the Medicare Beneficiary Annual Summary file, the Medi-Span therapeutic classification system, and the First Databank classification system. The Medicare Master Beneficiary Summary file provided the demographic data of Medicare and Medicaid dual enrollee status, age, sex, race/ethnicity, and census region. The Medicare Beneficiary Annual Summary file provided metropolitan status. The Medicare Part D PDE files provided the National Drug Code (NDC) for each prescription fill. The Part D Characteristics Data file was used to identify PDP enrollment. CMS-HCC and CMS-RxHCC prospective risk score models provided beneficiary risk scores and individual disease states utilized in the model.(1) The Medicare MDS files were used to identify nursing home stays. The Medi-Span therapeutic classification system (proprietary to Wolters Kluwer Health; license agreement held by CMS) was used to identify medication names. The First Databank classification system (proprietary to First Databank; license agreement held by CMS) was used to identify drug-disease interactions and drug-drug interactions.
Calendar year 2010 data were used to perform a cross-sectional analysis. Elderly (65 years and older) beneficiaries living in the United States with at least one prescription drug claim and enrolled in Part D for all 12 months of the 2010 calendar year were initially identified. Of these beneficiaries, we retained those identified with HF using the 2009 CMS-HCC flag (HCC80). The study sample was chosen based on diagnoses identified in 2008 to ensure the HF diagnosis had been made prior to the study period. Part-year dual enrollees and switchers between PDPs and MA-PDPs were excluded in order to more accurately measure the effects of dual eligibility and plan type. Enrollees with nursing home stays were also removed because performance on the medication measures may be influenced by consultant pharmacists working directly with these facilities.
Population characteristics addressed were census region, gender, age group, race/ethnic origin, disease burden, dual eligibility status, metropolitan area, Part D plan status, and prescription burden. Regional assignment was based on United States Census regions using the Social Security Administration’s state code of residence of the beneficiary (resident in the Medicare Master Beneficiary Summary file).(2,3) Age, race/ethnic origin, disease burden, and prescription burden were coded as categorical variables. Age was divided into the groups of 65-74, 75-84, and 85 and over. We divided race/ethnicity into the groups of black, Hispanic, non-Hispanic white, and other. Prescription burden was assessed based on the number of unique medications utilized by the enrollee during the 2010 calendar year.
Measures
Drug-disease interactions are present when an underlying disease alters the metabolism of a drug. An example would be giving sotalol to a patient with HF, which potentially could lead to proarrhythmic effects. Drug-drug interactions are present when one medication alters the metabolism of another medication. An example would be the potential for digoxin toxicity when given with amiodarone. In order to identify drug-drug interactions accurately, we imposed the condition that the intervening problematic drug had to be given within the day supply time-frame of two chronological prescription fills of the base drug. For example, a base drug with a fill date of January 1 for a 30-day supply having a second fill date of January 30 would be captured and compared with the intervening problematic drug having a fill date between January 1 and January 30.
Drug-disease interactions were identified by linking the NDC data (resident in the PDE files) to the First Databank classification system. Absolute contraindications (severity level 1) and relative contraindications (severity level 2) were identified. All diseases identified as being associated with a particular beneficiary were assessed in the analysis (i.e., not limited to HF). For drug-drug interactions, contraindicated drug combinations (severity level 1) and severe interactions (severity level 2) were identified. All medications identified as being associated with a particular beneficiary were assessed in the analysis (i.e., not limited to cardiovascular medications).
Analysis
We performed descriptive analyses separately for each of our quality assurance measures. We also fit logistic regression models to the data to evaluate enrollee and plan characteristics associated with outcomes on the measures. In the models, enrollee and Part D plan characteristics were the predictor variables used to predict the probability of the quality assurance event (i.e., the outcome event) occurring. Each predictor variable was composed of various groups. For example, the sex variable was composed of the groups female and male, whereas the region variable was composed of the groups Midwest, South, West, and Northeast. The outcome variable was dichotomous based on whether an enrollee had the quality assurance event during the study timeframe.
When interpreting the findings, the odds ratio (OR) estimate shows the strength of the association between the predictor variables and outcome variable. If the OR estimate is greater than 1, then the specific group comprising the predictor variable is more likely to have the outcome as compared with the reference group. For example, if female is the reference group for the sex variable and the male group is found to have an OR estimate greater than 1, then the male group is more likely to have the quality assurance event as compared with the female group. If the OR estimate is less than 1, then the male group is less likely to have the quality assurance event as compared to the reference group. An OR estimate of 1 indicates no association exists.
Each logistic analysis was conducted at the beneficiary level and allowed a measure to serve as the dependent variable for the respective analysis. Independent variables used in these later analyses included enrollee demographics and Part D plan characteristics. The models controlled for prescription burden (expressed as total number of unique medications) and disease burden (expressed as CMS-HCC risk score) because more diseases and medications provide more opportunities for poor outcomes on the medication measures. Prescription burden and disease burden were divided into the quartile groups of low, medium-low, medium-high, and high. Disease burden was assigned to the study population using the CMS-HCC prospective health risk adjuster score models for calendar year 2010. The models are risk adjustment models used for Medicare reimbursement. The models are used to predict cost of care of an individual in a given year even though it does not explicitly reflect how sick an individual may be in a given year. For the study, we use the models as a proxy for disease burden with the realization of this limitation. A higher risk score signified increased disease burden.
Analyses of the data were performed using SAS software (proprietary to SAS Institute Inc.; license agreement held by CMS). Results were reported as ORs along with p values.
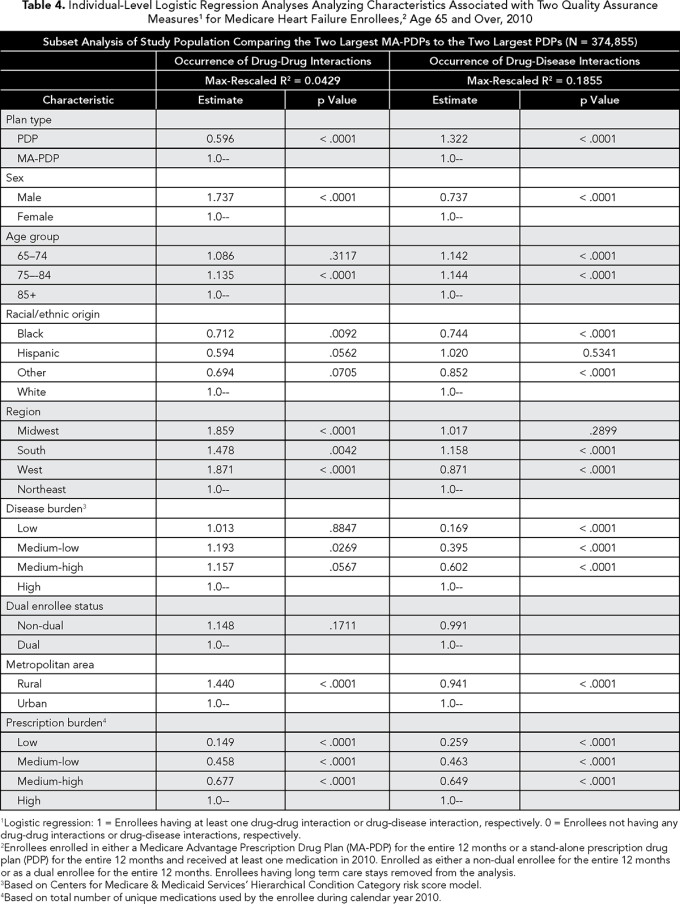
We also performed a separate analysis focusing on the larger MA-PDPs and PDPs. Using a subset of our study population, enrollees in the two largest MA-PDPs (n = 60,054) were compared to those in the two largest PDPs (n=314,801). Our goal was to see if performance on the measures might differ among the larger MA-PDPs/PDPs compared with prior analyses performed with all plans. Transaction costs in implementing more sophisticated systems that improve performance on the measures should be more manageable for the largest entities. Thus comparing these larger entities to one another should give a clearer benchmark for obtaining superior performance based on plan type.
Results
Based on our descriptive analysis, HF enrollees in MA-PDPs had better outcomes on each of the measures compared with enrollees in PDPs. For example, 23.7% of MA-PDP enrollees incurred at least one drug-disease interaction, whereas 26.8% of PDP enrollees incurred the same (p <.0001) (Table 1).
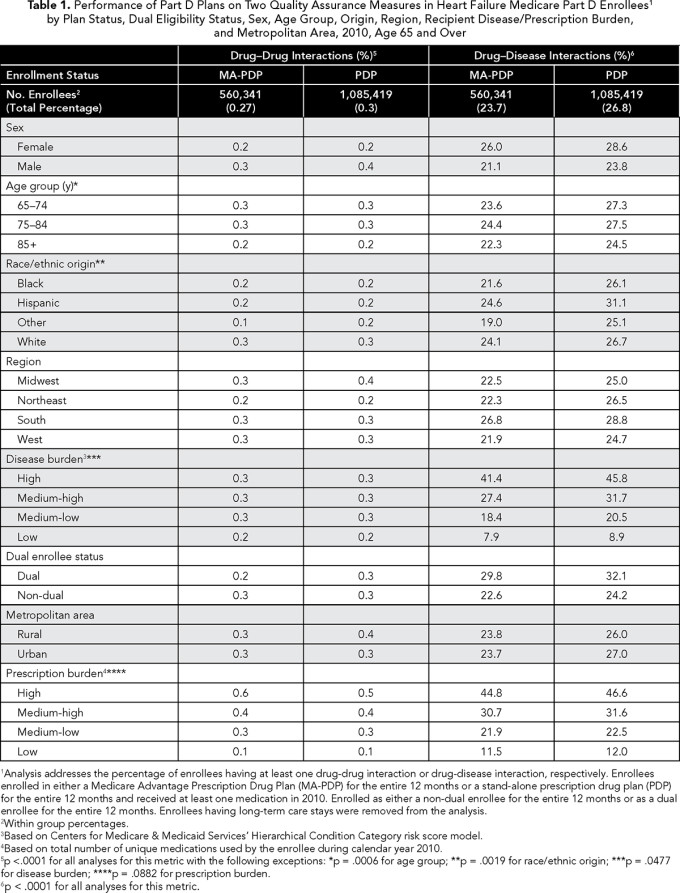
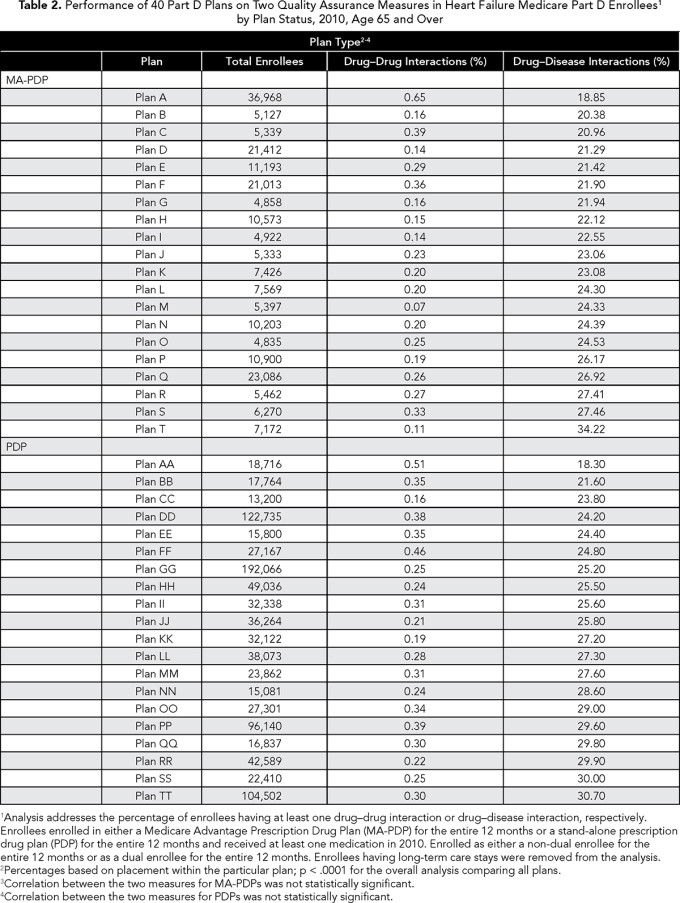
Cerebrovascular hemorrhage was involved in 25% of these events, usually in the presence of warfarin or isosorbide (data not in tables). Drug-drug interactions were rare in both types of plans (0.27% and 0.30% in MA-PDPs and PDPs, respectively). There was variation in performance across the PDPs and MA-PDPs (Table 2). For example, the percent of enrollees experiencing drug-disease interactions varied between 18.9% and 34.2% for MA-PDPs and 18.3% to 30.7% for PDPs. We also found that plan performance on one measure was not indicative of performance on the other measure. Among the 40 plans included in Table 2, drug-drug interactions were weakly correlated with drug-disease interactions (-0.22) (data not in tables).
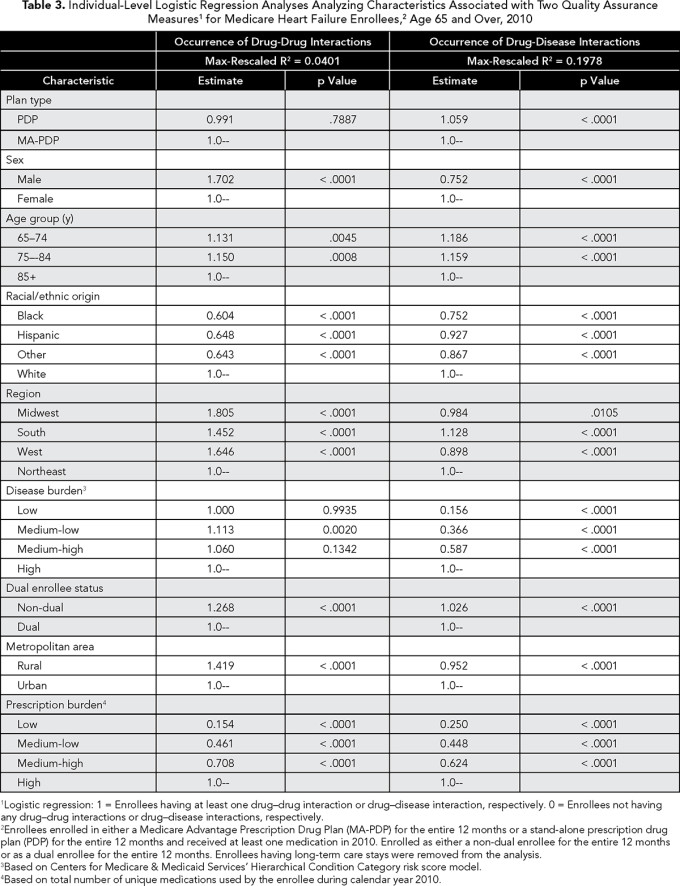
In bivariate analyses, performance on the drug-disease interaction measure appeared more problematic for PDPs (as compared with MA-PDPs), whereas performance on the drug-drug interaction measure was almost identical between the two plan types (Table 1). However, after controlling for the effects of beneficiary and plan characteristics in our individual-level OR analyses, we found that only performance for the drug-disease interaction measure was worse for PDPs (OR 1.059, 95% CI 1.050-1.068) (Table 3).
Our subsequent analysis targeting the two largest MA-PDPs and PDPs revealed a more striking difference (Table 4). The largest PDPs were considerably better with the drug-drug interaction measure than their MA-PDP counterparts (OR 0.596, 95% CI 0.509-0.698), but substantially worse with the drug-disease measure (OR 1.322, 95% CI 1.289-1.356).
Discussion
We found that drug-disease interactions are relatively common among elderly patients with HF, occurring in about a quarter of these patients. Drug-drug interactions, on the other hand, are rare. There may be considerable potential for improvement within the Part D program with respect to the former measure.
PDP enrollees with HF have similar outcomes to MA-PDP enrollees when comparing performance on the drug-drug interaction measure. However, PDP enrollees have somewhat worse outcomes when evaluating performance on the drug-disease interaction measure. This finding may be attributable to the availability of more current and complete diagnostic and clinical data on the part of the MA-PDPs. Such data are in theory available to MA-PDPs through the provision of acute care services to their enrollees under Medicare Part A and Part B. Additionally, by definition, MA-PDPs are required to coordinate care for their enrollees among doctors and other providers.
MA-PDP versus PDP differences were only part of the picture. Substantial inter-plan variation in outcomes existed across Part D plans within their respective classification as a MA-PDP or PDP. Several factors may influence outcomes of drug therapy, operating at the individual plan level, such as provider recruitment, data systems, formulary structures, quality assurance programs, and corporate oversight. The variation indicates room for improvement among plans with high rates of adverse outcomes.
The provision and use of richer clinical data may provide a pathway to improve performance on the drug-disease interaction metric. Schiff et al. proposed an approach to detect drug-disease interaction involving enhanced laboratory-pharmacy linkage.(4) Our findings are consistent with a more elementary approach involving the addition of real-time disease profiling. Real-time information identifying diagnosed diseases may be an important tool for controlling drug-disease interactions, especially during the critical weeks following an initial diagnosis.
Obtaining richer real-time clinical data on the part of PDPs may prove difficult without incurring additional expense through direct physician or patient contact. Currently, an integral part of quality assurance for conducting concurrent drug utilization review is medication monitoring via the use of an electronic database that collects medication claims data directly from the pharmacy. These electronic databases allow the PDP to scan electronically for drug-drug interactions with sufficient timeliness when a pharmacy submits a prescription claim to the electronic database.
Perhaps a practical approach at small expense would be enhancing the current information exchange between retail pharmacies and the PDP sponsor regarding the beneficiary’s disease profile. Requiring the pharmacy to send to the PDP sponsor the current disease profile of the patient (e.g., the pharmacy chooses applicable diseases from a drop-down menu) when submitting a prescription for claim adjudication could be an inexpensive solution; pharmacies already collect this information in their databases from patients at the time a prescription is presented by the patient. Additionally, the approach is not novel considering retail pharmacies are required to submit current diagnosis codes for payment for Part B drugs and supplies.
Enrollees in MA-PDPs may be healthier than enrollees in PDPs.
With the advent of the Affordable Care Act’s mandated electronic health records, our findings may be only temporary. It may be possible in the very near future for PDP sponsors to have access to complete clinical records and enabled them to contribute to the drug choice conversation, as well as participating in utilization review for clinical improvement and reduction in fraud, waste and abuse.
Notwithstanding, a clear need exists for increased coordination among a PDP sponsor and all other healthcare providers involved in a patient’s care in order for richer clinical information to be obtained by the PDP. Improvement in integrated data systems may be a viable solution.
Limitations
Our study utilized administrative data to model performance on quality assurance measures. Coding inaccuracy, omitted variables, and HF population identification may be problematic. We also perceive that findings based on our study population may neither be fully generalizable to the population nor generalizable to the Medicare population as a whole because we studied only elderly enrollees with HF who were not part-year dual enrollees or switchers between PDPs and MA-PDPs. It should also be noted that our findings are based on cross-sectional data and therefore suitable for identifying associations between measures and beneficiary and plan characteristics, but not causative relationships.
Other limitations we note are that enrollees in MA-PDPs may be healthier than enrollees in PDPs, and we used prior year data to identify disease states that would not provide concurrent diagnoses.
Lastly, drug-disease interactions and drug-drug interactions believed to be problematic may be considered appropriate following a thorough evaluation by the prescribing practitioner. For example, following the use of alternative therapies, a prescriber may determine that a contraindicated medication is the only agent that provides consistent outcomes for a particular patient.
Conclusion
Quality assurance is an important aspect of any Part D plan sponsor’s program. Based on our findings, we suggest that further improvement in performance may be gained for the drug-disease interaction measure, particularly for PDPs. However, we note that there are many drug-disease interactions in MA-PDPs as well. It appears there may be considerable room for more sophisticated use of real-time disease profiling in the processing of drug claims.
References
CMS Manual System. Pub. 100-16. Medicare Managed Care. June 7, 2013. www.cms.gov/Regulations-and-Guidance/Guidance/Transmittals/Downloads/R114MCM.pdf . Accessed December 1, 2014.
Regions and Divisions. The U.S. Census Bureau (2015). https://www.census.gov/econ/census/help/geography/regions_and_divisions.html?cssp=SERP . Accessed December 1, 2015.
Medicare Master Beneficiary Summary File. Research Data Assistance Center. www.resdac.org/cms-data/files/mbsf. Accessed December 1, 2015.
Schiff GD, Klass D, Peterson J, Shah G, Bates DW. Linking laboratory and pharmacy: opportunities for reducing errors and improving care. Arch Intern Med. 2003;163:893-900.