
Abstract:
Efficient practices are widely recognized to represent “best practices” in medical practice management, yet process improvement projects often are trivialized by providers. These projects may be viewed as “mundane” or “simplistic” by clinicians, and involve parts of the medical practice whose importance providers may not appreciate. We discuss the impact of a process improvement project that implemented standard workflows and processes. The realized improvements in service levels were impressive, evident within the first six months of process improvement, and have been sustained. In addition to improved call center service levels and patient satisfaction scores, morale in the call center has improved, and it was possible to reduce staffing due to improved efficiency.
Some aspects of medical care often are not considered adequately, such as process optimization for clinical procedures, optimization of workflow and templates to improve patient access, and “contact center operations” (such as operations of the call center and scheduling). Although attention to managing these processes is not as visible as delivering clinical care or conducting research, they are critical to ongoing operations, and have a major impact on the experiences of both patients and their referring physicians.
Contact center operation and front desk staff are major drivers of reported patient satisfaction.
Practice management surveys have identified contact center operation and front desk staff as major drivers of reported patient satisfaction in both academic and non-academic health systems.(1-3) Contact centers also can provide other services that support patient care and positive satisfaction responses.(2,4,5) Data obtained through direct interviews and The Ohio State University Wexner Medical Center (OSUWMC)’s physician contact management staff also support this view.
In July 2014, call center and scheduling operations for the OSUWMC department of neurology were in disarray, and the department’s community reputation was suffering as a result. Patients reported that while the providers were terrific, they were unable to reach people by phone, appointments were difficult to schedule, and telephone wait times were unacceptably long. Indeed, those wait times were averaging greater than 4 minutes, with monthly maximum wait times ranging from 17 minutes to 42 minutes. The call center exhibited very poor performance in all relevant performance metrics. In service level (SL), a summary performance measure, neurology’s performance was the worst within the medical center.
In August 2014, the department undertook a major overhaul of call center operations.
Interventions
On first analysis, the neurology call center had clear issues determining priorities. Call center representatives were delegated a wide range of tasks by providers and department administrators, many of which did not pertain to handling phone calls or the intake and scheduling of patients. The call center had essentially become a dumping ground for all miscellaneous work. This had the detrimental effect on morale and culture within the group that one might expect.
According to a standard Erlang calculation, one could determine with reasonable certainty the number of agents required to answer 80% of the calls in the first 30 seconds. Based on an average daily demand of 450 calls and an average talk time of 230 seconds (3 min 50 seconds), the minimum number of agents required to achieve an SL of 80% was between seven and eight. Thus achieving adequate call center performance metrics was not just a difficult feat, it was statistically impossible. The operation was simply not set up appropriately to yield desired results.
Although a focus on talk time reduction could have improved performance on some metrics, we hypothesized that engaging agents in refocusing their work and maximizing call center agent availability would lead to a more lasting improvement. This was brought about through two fundamental changes.
The first was constraining all non-call-center-related tasks. Two of the authors met with and observed the call center operations in real-time, interviewing agents individually and as a group to help identify their perceived barriers to success. Some nonessential work was eliminated completely. Other work was transferred to more appropriate staff, or prioritized as “downtime work” to be completed only during scheduled times of the day. This intervention freed up the existing call center agents’ time and provided an expected boost in morale.
The second strategy leveraged additional resources from the larger call center (OSUWMC’s patient scheduling center). The neurology call center was not very large and had no ability to take advantage of economies of scale. Partnering with the main scheduling center permitted allocation of two FTEs to the neurology call center team during the improvement phase. The augmented staffing allowed for immediate stabilization of the hemorrhaging performance statistics (Figure 1). From the outset, this additional effort was expected to be redeployed after neurology’s call center processes were improved significantly and stabilized.

Figure 1. Time series of calls abandoned.
Seeing sustained success and continued engagement with call center leadership has resulted in a lasting improvement in morale.
The project team worked diligently to procure additional call center agents and negotiated the removal of nonessential tasks. In the midst of these efforts, three employees abruptly resigned, having reached their professional breaking points. Prior to these interventions, turnover had been rampant, reflecting the relentless demands of complaining customers (and providers). Once these positions were refilled, performance rebounded rapidly. Before long, daily SLs expressed as a percentage oscillated within a very acceptable 70% to 85% range. Seeing sustained success and continued engagement with call center leadership has resulted in a lasting improvement in morale.
Further standardization of scheduling processes allowed roughly 35 seconds to be shaved off the average talk time during the period of July 2014 through June 2015. These efforts included improved triage workflows and increased scheduling authority for call center agents. Although reducing talk time was not one of our primary strategies, that reduction increased workforce capacity without having to hire additional resources. SL and talk time performance measures have been sustained since early 2015.
Data
Our call center uses several measures for monitoring performance. The data presented extend from July 2013 through March 2016, a period that spans several months prior to intervention and the 18 months following intervention. The call center measures can be considered to fall into two broad categories: (1) call volume; and (2) availability:
Call volume
Total calls offered, which is the number of inbound calls received. For reference, in 2013, the neurology department call center had the highest inbound call volume of non–primary care call centers.
Total calls handled, which is the number of calls successfully handled.
Calls handled within the SL threshold of 30 seconds.
Additional relevant volume metrics can be calculated, such as the percentage of calls handled and calls offered (and calls handled) per day.
Availability metrics
Calls abandoned, which are calls that were disconnected before they were answered by an operator. This accounts for nearly all calls offered that are not handled.
Average speed of answer, which is the time between an inbound call being offered and the call being answered. OSUWMC targets an SL threshold of less than 30 seconds (Figure 2).
Average talk time, which is the duration of call.
SL (expressed as a percentage), which is a calculated number based on total calls offered, calls abandoned, and average speed of answer. OSUWMC’s average for SL was about 55% across all clinical departments during this time period.
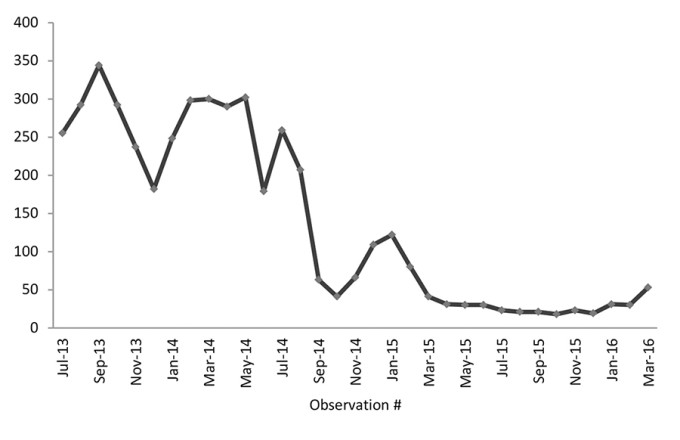
Figure 2. Time series of average speed of answer (in seconds).

Statistical analysis was performed using StatTools (Version 7.0.1 build 396, Palisade Corporation). Key indicators of call center service were analyzed for correlation using the Pearson linear correlation technique. Data from six months prior to implementation of standard work procedures were compared to data from six months after project completion using a time series approach similar to that used by others in assessing process improvement.(6,7)
Results
Summary data of call center volumes (calls offered per month, calls per working day, calls abandoned) are presented in Table 1. A time series graph of the data demonstrates a clear increase in number of calls handled within less than 30 seconds, a decrease in abandoned calls, and vast improvement in SL (Figure 3). Trend analysis of the data indicates sustained improvement over time. Also evident in the trend analysis is a period of relative setback (December 2014 to January 2015). During this period the call center experienced 30% decreased staffing due to unexpected resignations and sick time, as well as the physical relocation of the call center in January 2015. Despite these disruptions, performance rapidly returned to the previous levels, demonstrating the resilience of the standardized workflow.


Figure 3. Time series of service level.
We used linear correlation to explore the relationships between these variables and their relationship to time (Table 2).

Discussion
As hoped, the call center overhaul rapidly had a positive impact on all target metrics. Specifically, the SL and calls handled within 30 seconds both improved substantially, while calls abandoned and average speed of answer both decreased. Several of these measures show strong correlations, as summarized in Table 2.
It is expected that the calls offered would have strong correlation with calls abandoned. There was also a moderate correlation with average speed of answer and average talk time. The strong correlation between time and calls abandoned (–0.893) reflects improved performance over time, as do the strong correlations of time with average speed of answer (–0.882), SL (0.909), percentage of calls handled (0.894), and number of calls handled < SL threshold (0.855).
Interestingly, the total number of calls offered has a correlation of –0.644 with time, as did the number of calls offered per day (–0.695). We suspect that this may reflect the decreased need for callers to call repeatedly (after abandoning the previous attempt). This hypothesis is supported by the strong correlation between the speed of answer and calls abandoned (0.951). Process improvement also may result in fewer referring offices calling to check on referral status and faster resolution of patient concerns.
SL had a strong correlation with time (0.909), percentage calls handled (0.955), calls handled < SL (0.975), and a strong negative correlation with average speed of answer (-0.948) and calls abandoned (-0.949), as expected.
As an exploratory analysis, we evaluated the call volume metrics in relation to month of the year. No strong correlation was found between month and calls offered (correlation coefficient -0.125). If one had been found, we could have adjusted call center staffing to anticipate months having higher volumes.
This statistical analysis was helpful in several ways. First, it confirmed that the changes (including continuous process improvement) have resulted in a dramatic, sustained improvement among all key performance indicators for the call center. Second, the exploratory analysis did not find any substantial variation in call volume (or call duration) by month, suggesting that the current model of level staffing throughout the year is matched to the demand.
In addition to demonstrating the dramatic improvement in performance associated with implementation of standard work practices, our report contributes to the collective practice management knowledge by demonstrating that these changes can be confirmed through rigorous statistical analysis. The most recent months illustrate the usefulness of graphical representation to draw attention to possible emerging trends that could impact performance.
While our report provides direct evidence of the impact of the strategy on quantifiable metrics, their impact on patient satisfaction can only be inferred. Indeed, any causal relationship between medical practice operation and assessment of nebulously defined “satisfaction” will be inferential and transitory. As technology continues to exert a shaping influence on interpersonal and professional communication, contact center operations will need to adapt to these changing preferences.(8)
References
Bowman B, Smith S. Primary Care DirectConnect: how the marriage of call center technology and the EMR brought dramatic results–a service quality improvement study. Perm J. 2010;14(2):18-24.
LaVela SL, Gering J, Schectman G, Weaver FM. Optimizing primary care telephone access and patient satisfaction. Eval Health Prof. 2012;35(1):77-86.
O’Neill S, Calderon S, Casella J, Wood E, Carvelli-Sheehan J, Zeidel ML. Improving outpatient access and patient experiences in academic ambulatory care. Acad Med. 2012;87(2):194-199.
Gustafson BM. A well-staffed PFS call center can improve patient satisfaction. Healthcare Financial Management. 1999;53(7):64-66.
Scrivo R, Priori R, Coppola M, et al. Use of a contact center telephone helpline in rheumatology outpatient management: a five-year experience analysis and patients’ perception. Mod Rheumatol. 2014;24(4):585-589.
Chaboyer W, Lin F, Foster M, Retallick L, Panuwatwanich K, Richards B. Redesigning the ICU nursing discharge process: a quality improvement study. Worldviews Evid Based Nurs. 2012;9(1):40-48.
Rohleder T, Bailey B, Crum B, et al. Improving a patient appointment call center at Mayo Clinic. Int J Health Care Qual Assur. 2013;26(8):714-728.
Shultz SK, Wu R, Matelski JJ, Lu X, Cram P. Patient preferences for test result notification. J Gen Intern Med. 2015;30(11):1651-1656.
Topics
Strategic Perspective
Action Orientation
Critical Appraisal Skills
Related
Research: As Careers Get Longer, Midcareer Work Needs to ChangeThe Power of Strategic CenteringWhat Global Companies Lose When Decision-Making Revolves Around Headquarters