
Abstract:
Physician practices have historically had difficulty benchmarking their services because there are limits to the transfer of payment information among healthcare providers. Using standard analysis tools (e.g., Microsoft Excel) and data from CMS, we outline and provide a detailed example of how a physician practice can benchmark one revenue stream within its local geographic market. The data cover patients serviced under original Medicare from 2012 to 2014.
In today’s healthcare payment environment, with transitions from fee-for-service to value-based payment metrics, understanding the revenue streams for your practice is essential to your practice’s overall financial health. The lack of easily available, affordable data has prevented many practitioners from performing revenue analyses in the past. Using standard analysis tools (e.g., Microsoft Excel) and free data, physicians can benchmark one revenue stream within their local geographic market.
Physicians and their accountants can use public data to better understand their local healthcare marketplaces.
Medicare is one of the largest payers for healthcare services and goods in the United States. In April 2014, CMS released data detailing the amount paid to specific physicians for providing certain services to Medicare patients during 2012. CMS followed with a second release of data in April 2015, covering the 2013 calendar year, and a third release in April 2016 for the 2014 calendar year. Physicians and their accountants can use these public data to better understand their local healthcare marketplaces.
We illustrate how Annette, the business manager/accountant for a hypothetical family medicine physician practice in Muncie, Indiana, can easily access and analyze the data to benchmark her physician practice against others in the area using existing tools and free data. This will help the physicians in Annette’s practice understand who services the seniors on traditional Medicare in their local market and gain insight into how their practice compares to other area medical practices.
Accessing the Data
To begin, Annette searches the CMS website (www.cms.gov ) for the “Medicare Provider Utilization and Payment Data: Physician and Other Supplier” information (Figure 1) to obtain the Medicare Part B data. These data relate to payments for physical goods and services that are medically necessary as prescribed by a doctor or are related to a preventative service, such as an influenza vaccine. Healthcare providers in this data set include physicians, chiropractors, physical therapists, nurse practitioners, and other medical personnel. Additionally, the data set includes entities that provide these goods or services—for example, Walgreens and CVS. Individual patients cannot be identified, because a minimum of 10 Medicare fee-for-service beneficiaries are required for a healthcare provider/entity to be included in the data.
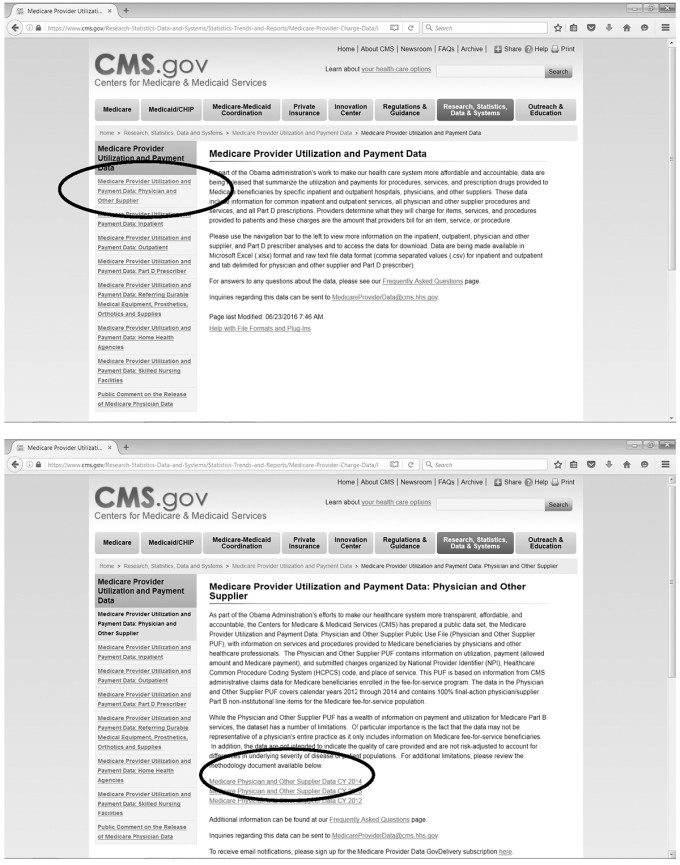
Figure 1. Medicare provider utilization and payment data. Source: CMS.gov .
The data cover three calendar years: 2012, 2013, and 2014. The summary file data contains a single record for each healthcare provider. Thus, the data cover 986,677; 956,294; and 880,644 healthcare providers for 2014, 2013, and 2012, respectively. Annette chooses to begin with 2014 and the summary file to identify the set of providers against which to best benchmark her practice.
The physician data are available in multiple formats, including a tab-delimited zip file, or ultimately downloadable into Microsoft Excel. To access the 2014 summary data, Annette chooses the “Interactive Dataset” link under the “Provider Summary Table” option (Figure 2A), clicking through the license acceptance screen. She selects the interactive dataset because the tab-delimited file exceeds the capacity of Microsoft Access and requires statistical software such as SAS to open. Annette can select filters on the interactive data set to restrict the records to her local geographic area, a best practice when dealing with Medicare data, because geographic location is a key criterion for the payment rate. The first geographic filter could be the state. The “add a new filter condition” button can be depressed to include the city (Figures 3A and 3B). Other filters can be added to further restrict the record set downloaded, for example, by specialization. However, if the filters do not automatically populate on the screen, the arrow indicates the button to select to make the filters appear (arrow in Figure 3A). Once she has defined the required dataset, she selects the “export” option (arrow in Figure 3C) and the “CSV for Excel” option (circle on Figure 3C). She can decide to analyze a single year. However, if she wants to obtain information for the two prior calendar years, then the data are accessed in a slightly different manner.
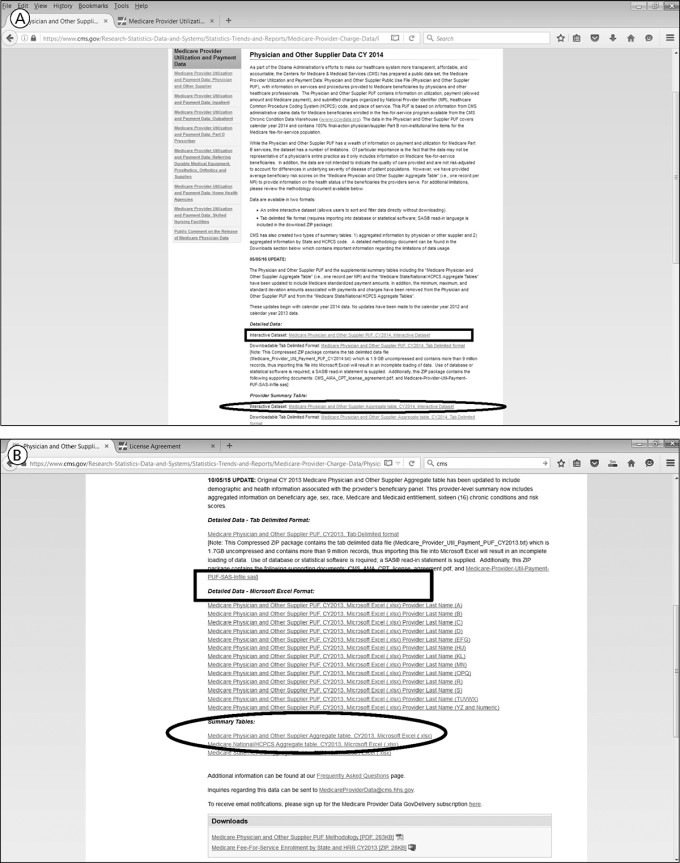
Figure 2. Highlighting the specific links for accessing the data. A, To access the 2014 summary data, the “Interactive Dataset” link under the “Provider Summary Table” option is chosen. B, For calendar years 2012 and 2013, the summary data by physician are downloaded using one of the Summary Table Excel spreadsheets found at the bottom of the Web page. The ovals in A and B show links to the summary data. Once the appropriate candidates for benchmarking the practice are identified, more detailed data on each provider can be accessed (through the links shown in the rectangles in A and B). Source: CMS.gov .
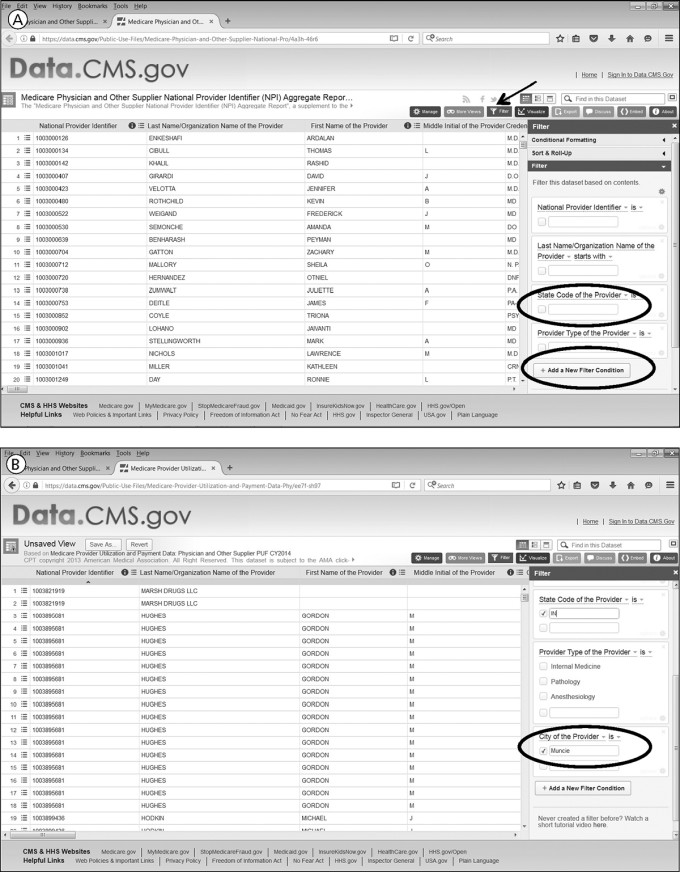
Figure 3. Filters can be selected on the interactive data set to restrict the records to a specific geographic area. The first geographic filter could be the state. A and B, The “add a new filter condition” button can be used to include the city. Other filters can be added to further restrict the record set downloaded. If the filters do not automatically populate on the screen, the arrow (panel A) indicates the button to make the filters appear. (Continued below)
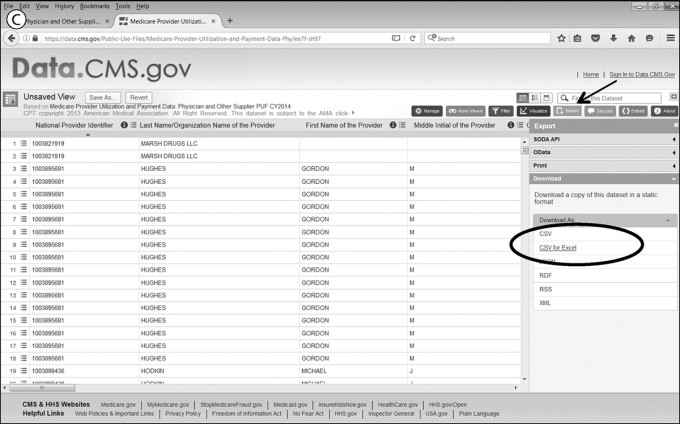
Figure 3C. Once the required dataset has been defined, the “export” option (arrow) and the “CSV for Excel” option (circle) are selected. Source: CMS.gov .
Prior Calendar Years
For calendar years 2012 and 2013, she downloads the summary data by physician—one of the Summary Table Excel spreadsheets found at the bottom of the Web page (Figure 2B). Once the spreadsheet downloads for 2012 or 2013, Annette whittles down the large spreadsheet to those records of interest. Filters embedded in the header row can easily restrict the records to smaller subsets. Because she is benchmarking the local healthcare landscape of Muncie, Indiana, she uses the filters related to geographic location and chooses to identify records related to payments made to entities and individuals in Muncie. By choosing the state filter first, she notices that Muncie has several spellings, most likely due to data entry errors in the spreadsheet, and selects all alternative spellings, which include “Muncle” and “Munice.” Alternatively, she could have used the zip code field to filter providers to a specific geographic region. However, the zip code data are in the zip+4 format, requiring many boxes to be checked with the zip code filter to obtain all the providers in the same five-digit zip code.
Next, to further restrict the records to similar providers, Annette filters the records by the main specialization of the individual providers, because the data file contains many different provider types for individual healthcare workers. Because she works for a family practice, she restricts the data to those records with “Family Practice” as the main provider type. The resulting data set includes records for her own practice, allowing Annette to be confident that the data reflect her local market. If Annette wanted to see other entities that provide similar services to her practice (and to compare her practice to other physician practices), she could obtain the providers’ name from this Excel sheet and drill down with each specific healthcare provider/entity. For example, she could see the volume of seniors preferring to obtain their influenza vaccination from the local supermarket or drugstore pharmacy. Once she has obtained similar data for 2012 through 2014, she merges the records into a single Microsoft Excel spreadsheet for analysis.
The limited context about the patients’ health is important to consider when performing the data analysis.
As CMS releases data for each subsequent calendar year, the agency is adding additional details concerning patient population characteristics served by a particular physician. For the most recent year, 2014, data on ethnicity and some chronic conditions are available for certain providers. Chronically ill patients need more care, which will result in higher Medicare payments under original Medicare. Therefore, the limited context about the patients’ health, visible at an aggregated level, is important to consider when performing the data analysis.
Analyzing the Data
Annette examines the downloaded records to gain insight into the practice of family medicine in Muncie, Indiana, regarding the patient population who have original Medicare as their payer. Medicare also pays private insurance companies to provide equivalent Medicare Part B services, along with Part A services, through a separate program called Medicare Advantage. As seniors can choose either original Medicare or Medicare Advantage plans, the number of beneficiaries on these Excel sheets potentially understates the number of seniors serviced by any single physician. However, this data limitation does not reduce the usefulness of the benchmarking exercise. For example, the physicians in Muncie have Medicare fee-for-service patient bases ranging from 13 to 1379 unique individuals during 2013. The lower level is skewed, because physicians with fewer than 10 unique patients are not included in this file, to protect patient identities.
Annette continues to work with the summary file data. She is aware that doctors often practice together in a multiphysician practice. Accordingly, she combines records with a similar address into an aggregated practice total. For each practice address, she calculates the total Medicare payment received. The physician practices range from single practitioners to practices with more than 10 physicians within this geographic area.
Detailed Data
Annette’s analysis of the practice units allows her to identify the best benchmarking candidates. Potential metrics include those similar in the number of Medicare patients seen or number of physicians, along with specialization. Once she determines the appropriate candidates for benchmarking her practice, she accesses more detailed data on each provider (rectangle in Figures 2A and 2B). Within each physician’s details, Annette can see the following: the HCPCS identifier and description billed to Medicare; the number of beneficiaries for each procedure; the average payment amount received for each procedure; and the average amount charged for each procedure. The data set covers more than 5900 specific procedural codes. The most common procedural codes relate to office visits for established patients. These procedural codes are important within Annette’s analysis of the Medicare Part B, fee-for-service data. The codes are used to identify those other practices providing similar services to hers: that is, the service mix.
Under the fee-for-service paradigm, a physician is paid each time he or she performs a particular procedure. Although some procedures can be performed multiple times on a single individual, other procedures must only be performed once on a patient. Also, the combination of procedures (e.g., multiple procedures performed in one office visit or in separate visits) potentially affects the financial amounts, especially the Medicare payment amount. Annette expects those physician practices with higher beneficiary counts to receive the larger Medicare payments. The importance of service mix is highlighted with a 2013 example, when the physician with the second fewest beneficiaries did not receive the second smallest payment. He received $2,208.90 for 25 unique beneficiaries, whereas another physician received $1,366.43 for 78 unique patients.
For 2012 and 2013, this analysis requires downloading all the related files of the respective physician or healthcare parties’ names with whom you want to benchmark. For 2014, it requires filtering by the respective National Provider Identifier (NPI) codes identified using the summary file data. Annette enters multiple NPI codes into the respective filter and downloads the resulting spreadsheet in a similar fashion to the summary file. Once downloaded, she merges the data into a single file for additional analysis.
The variability in charge data submitted to Medicare provides some insight into the payer and cost mix of other physician practices.
Another reality with the fee-for-service paradigm relates to the HCPCS codes used in the files. The healthcare provider should perform only procedures that are medically necessary based on the patient’s needs. Therefore, the detailed physician files reflect procedures performed by the physician. Annette cannot infer anything about any absent HCPCS codes because a patient’s health status may not require a certain procedure during the time period covered by the data sets.
Once Annette has pulled together the data for the various similar practices within her market, she can readily see which physician practices serve seniors in the same volumes and with similar procedures. Most importantly, the variability in charge data submitted to Medicare provides some insight into the payer and cost mix of other physician practices. For example, the submitted charges to Medicare reflect an overall “rack rate” for the practice for specific procedures, although patients rarely pay the rack rate. However, the submitted charge should reflect the practice’s charge for an uninsured individual who does not receive any financial assistance. The difference between the rack rate and the actual payment amount provides insight into the potential write-off amount that a practice might need to absorb when servicing Medicare patients. Also, the closer the practices’ rack rate is to the Medicare allowed amount, the more likely it is that the dominant insurer for their patients is the federal government, implying fewer privately insured patients.
Data Limitations
There are three caveats to interpreting the total payment amounts. First, the Medicare payment amount should not be interpreted as directly equivalent to the physician salary for performing the procedure. The payments include recovering for office overhead, malpractice insurance, staff salaries, and other practice costs. Because geographic location is an important variable in the Medicare payment formula, physicians performing the same procedure in different parts of the country might receive different payment amounts. Thus, the local focus to this benchmarking exercise is crucial.
Data reflect payments where no disputes remain.
Second, primary physicians supervise other healthcare professionals (for example, a physician assistant or nurse practitioner), who may bill under the physician’s identification number. Accordingly, there are individuals with higher numbers of beneficiaries and more services than might appear possible to provide within a year. These outliers, relative to other practices in the area, might deserve to be benchmarked differently.
Third, the data reflect payments where no disputes remain; disputed payments are excluded. The payment-received data do not include patient copays or other insurer payments that the physician practice might receive for the included procedures, although these pieces are included in the Medicare allowed amount. Also, the data only reflect the total amount paid for a procedure if the doctor completed the procedure in an outpatient setting. The data do not completely reflect payments for an inpatient procedure, as the hospital bills the patient separately from the physicians providing the service. The hospital data are not included in this data set.
Conclusion
Overall, with the data she has acquired, Annette has a clearer picture of the place her physician practice holds in regard to serving the seniors insured by Medicare within her local community. With multiple years of data, a business manager can contemplate doing more extensive trend analyses for their local market. This information could have implications for the practice’s acceptance of new patients, especially those using Medicare, for contracting relationships with private insurers, and the acquisition of information to prepare for future changes in the healthcare payment paradigm.
In summary, small physician practices historically have had difficulty benchmarking their services, because there are limits to the transfer of payment information among healthcare providers. There has always been an option to pay for benchmarking services from an organization such as the Medical Group Management Association. However, CMS’ release of Medicare data now allows physician practices accountants to benchmark their activities against the local physician landscape without incurring any cash outlays.