
Abstract:
In clinical practice, the concept of efficiency often is equated with procedural skill or high-throughput units. A basic health economic definition of efficiency, however, compares the ratio of outputs to inputs in a specific process. Expanding the concept of efficiency beyond temporal domains may inform and enable healthcare decision-makers in how best to improve quality and processes. We discuss the concepts of allocative and technical efficiency as applied to healthcare, and then review the statistical technique of data envelopment analysis (DEA) that aids in quantifying efficiency. We conclude with an example of the application and interpretation of DEA in clinical and administrative practice.
The Economic Concept of Efficiency and Its Application to Clinical Practice
In clinical practice, one often hears of a “technically excellent” surgeon, or a “highly efficient” team or process. Although these claims often are true, the question should arise as how to best translate these descriptions from mere observations to quantifiable values, thereby enabling reliable intra- and intergroup comparisons. This desire to objectify and improve clinical performance parallels the economic concept of efficiency.
The development of the concept of efficiency owes much to the work of economists. In an effort to better describe the yield per unit worked, the concept of efficiency gained traction across other disciplines. There are many different definitions of efficiency, but all focus on the principle of transforming inputs to outputs. For example, the Agency for Healthcare Research and Quality (AHRQ) defines efficiency “as an attribute of performance that is measured by examining the relationship between a specific product of the healthcare system (also called an output) and the resources used to create that product (also called inputs).”(1)
Such efficiency measures can be classified as a ratio, an index, or a model estimate. Within the realm of healthcare delivery, however, the concept of efficiency may easily diverge from its classical (simple) ratio analysis of outputs to inputs. Used colloquially, efficiency may come to be equated with speed, particularly when applied to procedural interventions in a clinical environment. Using this example, the outputs of interest from the intervention could be confined to door-to-balloon time, hospital length of stay (LOS), procedural success rates, or procedural duration. Although it certainly is helpful from an operational perspective, restricting the concept of efficiency to a purely temporal domain diminishes its potential applicability to assisting physician leaders and practice managers in identifying opportunities for clinical performance improvement. Additionally, a fuller understanding of the economic concepts of efficiency may offer leaders the opportunity to recognize and reward existing high-quality work within an organization.
Clinical Perspectives on Efficiency
The concept of efficiency can be examined as allocative efficiency versus technical efficiency.(2) In clinical practice, allocative efficiency often is invoked in the context of financially constrained circumstances, with the goal of equating marginal benefits and marginal costs across that system’s programs. Achieving maximal allocative efficiency within the dynamic environment of healthcare delivery may be challenging as differing parties with competing interests compete for constrained resources. Alternatively, technical efficiency describes the maximum production of an output given a set of inputs. Technical efficiency may be thought of as a measure of the “optimal” strategy for process completion. Although this seems uncomplicated, assessing technical efficiency in real-world practice can be quite challenging. Numerous variables may affect a process, and quantifying these variables may or may not be feasible, especially in a clinical setting. Nonetheless, quantifying technical efficiency allows for data-driven comparison between processes and people—and represents, therefore, an attractive methodology for clinical leaders seeking to improve quality measures such as processes and outcomes.(3,4) Technical efficiency may be thought of as operating on a frontier curve.(5) Deviation from this frontier may be thought of as inefficient performance, and may, therefore, guide decision-makers in recognizing opportunities for attaining optimal performance.
Quantifying Efficiency: The Role of Data Envelopment Analysis
How best to measure efficiency in the clinical environment has been the subject of substantial research and investigation. Regression techniques have been proposed as a method of describing efficiency. Although useful in describing associations and identifying predictive variables for a dependent outcome of interest, regression techniques may fail to identify optimal performance that also may be thought of as most efficient performance.(1,6) Regression methods may permit the inclusion of numerous independent variables, but they may give misleading results by labeling highly efficient entities as outliers.(7,8)
Data envelopment analysis (DEA) is a nonparametric analytic technique that has been widely adopted throughout multiple industries to describe the efficiency of systems.(7,9) Whereas regression analysis is designed to find the average (mean) efficiency between inputs and outputs, DEA is designed to find the best practice (i.e., units that are on the leading edge of the frontier). Similar to regression techniques, DEA incorporates user-defined inputs and outputs to describe the efficiencies of different units under investigation. Outputs may include a variety of health-related endpoints, including clinical outcomes and health services delivered.(1) Outputs also may include costs, costs per case, or costs per hospitalization, for example. The ability to tailor the outputs of interest in DEA analysis is attractive to clinical managers, because a wide range of outputs may be assessed across a clinical service area, or even at the individual provider level.(6,7) Inputs entered into a DEA model also may represent a spectrum of clinical variables of interest to managers and clinicians alike. McGlynn et al.(1) subdivide inputs into two broad categories: physical and financial. Physical inputs may refer to actual medical supplies or may represent effort assigned by a provider to a particular task. Financial inputs typically are costs associated with generating a tangible output. Practice managers may have a particular interest in examining financial inputs for a given output, because this may aid in better understanding the relative efficiencies of physicians and providers in a shared clinical ecosystem.
DEA allows for comparison between differing entities for a given set of inputs and outputs. DEA modeling refers to each of these entities as a decision-making unit (DMU).(9) DMUs are compared to one another in DEA analysis via frontier analysis. Frontier analysis involves the construction of a leading-edge frontier, along which efficient DMUs are plotted. Inefficient DMUs are located away from the frontier. Although frontier curves illustrate the concept of efficiency, from a practical perspective it may be onerous to employ this technique in the managerial practice of medical groups. Fortunately, numerous software and statistical packages are available that perform DEA readily and produce easily interpretable results. When performing a DEA of a fixed number of DMUs, analytical software will identify the most efficient DMU in the cohort (i.e., best practice relative to the group). This DMU is assigned an efficiency score (θ, theta) against which the remaining DMUs are benchmarked. The lower a DMU’s assigned θ value, the less efficient that DMU is within that specific analysis. Caution should be taken when interpreting the (in)efficiencies generated by a DEA.(9) In DEA, efficiency calculations are specific to the analytical framework created by the user when selecting the inputs and outputs that are incorporated into the DEA. Consequently, correct selection of input and output variables are vital to performing DEA accurately.
Case Study: Quantifying Physician Procedural Efficiency
An example of the potential utility of DEA in clinical practice management is the quantification of efficiencies of physicians who perform the same operative procedure in a clinical venue. Informal efficiency estimations in these settings often become synonymous with shorter procedural times or lower complication rates. These variables are informative, but when viewed in isolation they may fail to fully portray efficiency estimates to clinicians and administrators alike.
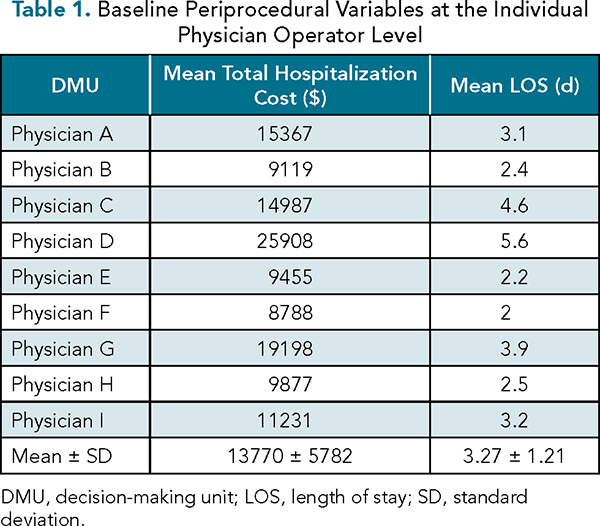
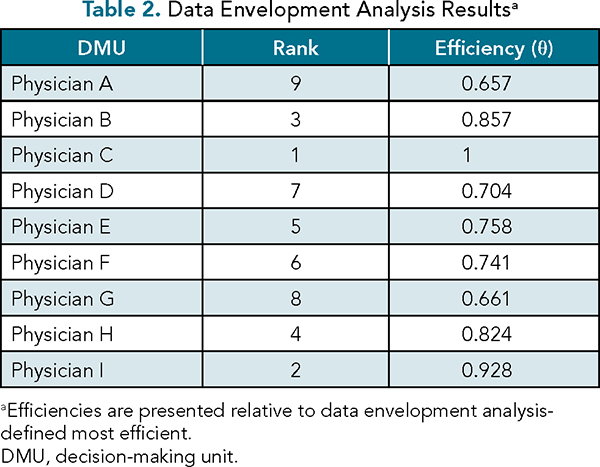
To illustrate DEA, let us hypothetically assume that a surgical administrative team wishes to share with its staff surgeons their relative efficiencies as pertaining to a particular procedure. Assume that a total of nine physicians (designated A-I) all perform an identical procedure homogeneously shared from a specific patient population. A recent increase in emphasizing earlier appropriate hospital discharges has prompted the team to reexamine each physician’s efficiency. Hospital LOS has been identified as a potential opportunity for improvement, based on internal review. Financial data related to average direct cost-per-hospitalization also has been a recurring topic of discussion within the leadership team. Base case data for each of these variables are presented in Table 1. Preliminary analysis of these variables reveals substantial variation in mean hospitalization costs between surgeons. To better describe physician efficiency, a basic DEA analysis using an input orientation was performed using Stata (StataCorp; Chicago, IL), incorporating mean total hospitalization cost as the input and mean LOS as the output. The orientation of the DEA model (either input or output) is reflective of which variables are of interest to be modified.(9) In our example, we select an input orientation, because our administrative team is interested in cultivating initiatives to achieve hospitalization-related cost savings. The results are presented in Table 2. The results of this simplified DEA model demonstrate that most physicians’ efficiency values congregate between θ = 0.7 and θ = –1. Two physicians (A and G) appear to be the least efficient in this analysis, both performing roughly 35% less efficiently than Physician C.
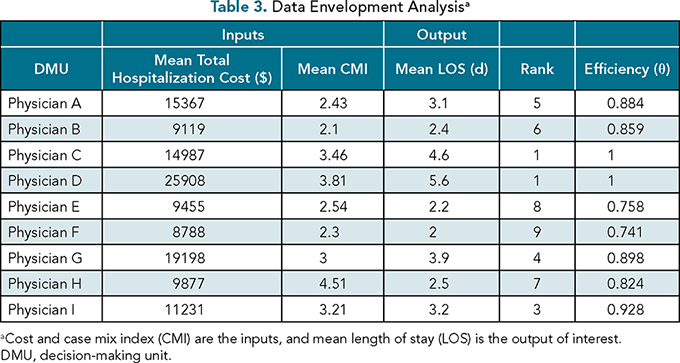
Upon sharing these results with the surgical group, concerns were expressed by physicians that the model failed to incorporate variables describing the degree of underlying patient complexity. The surgical group requested that their respective case mix indices (CMIs) be integrated for the procedures under examination to better refine the model.(10) Consequently, DEA was performed once again, incorporating mean hospitalization cost as a financial input, but now adding CMI as a clinical input. The output of the analysis remained mean LOS. The results of this expanded DEA are presented in Table 3. When compared with the previous DEA, we observe that the efficiencies have been altered by the inclusion of CMI. Physician C is now joined by Physician D as the most efficient operators. However, the addition of an aggregate clinical variable, CMI, has improved Physician A’s ranking. In the previous analysis, Physicians E and F had ranked fifth and sixth, respectively; integrating a composite clinical variable, however, causes them to fall to the least efficient positions in this analysis. Using these new findings, clinical and administrative leadership may objectively engage with these physicians to better understand the drivers of their relative inefficiencies when compared with their peers. As may be appreciated from review of Table 3, visual estimations of efficiency may be counterintuitive. When reviewing Physicians E and F, despite relatively shorter LOS values, hospital costs appeared higher per hospitalized day. Further, their lower CMI values also may have influenced their relative inefficiency when compared with physicians who operate on “sicker” patients at a lower cost per hospital day. Although it is hypothetical and oversimplified for illustration purposes, our analysis highlights the role DEA can play in supporting data-driven quality and financial improvement initiatives in a wide variety of clinical settings.
Although DEA has many attractive features, the technique does have limitations.(9,11) It is important to recall that DEA-defined DMU efficiency values are relative to one another. This exposes the model’s results to potential selection bias if relevant DMUs (in our example, surgeons) are excluded from the analysis. Mirroring these concerns would be the potential for introducing bias if the DMUs selected are of significantly different size, location, or composition (unless one accounts for these in the variable selection). Thus, when constructing a DEA model, it is vital to select inputs or outputs that will allow for appropriate benchmarking across units to guide crucial decision-making.
A Word on Innovation
On the production line, a process innovation may lower product costs and improve production efficiency, creating opportunities for pricing reductions or greater business margins. Monopolistic conditions may be created, thereby reducing the innovation’s benefit to society. In the procedural suite, a medical device innovation that reduces complications or improves outcomes also may create efficiencies (e.g., reduced LOS, lower complication rates). However, the efficiency benefits of medical device innovations often are diluted by medical marketplace intermediaries. Monopolistic “centers of excellence” often leverage the power of an innovation to gain market share, at least until the innovation becomes more widely disseminated. In the complex U.S. quasi-market and other global health systems, these evolving contextual factors can impact DEA and, therefore, warrant careful consideration.(12,13)
Conclusions
DEA offers another robust tool for managers and clinicians alike seeking to quantify efficiency. DEA may be applied to a wide variety of clinical scenarios, and its capacity to incorporate numerous input and output variables furthers its attractiveness to data-driven managers aiming to enhance productivity, quality, and efficiency while identifying opportunities for cost savings. Recognition of the importance of conscientiously entering input and output variables is vital to creating meaningful and actionable DEA results. As healthcare reimbursement continues its journey from volume to value, techniques such as DEA will constitute an increasingly valuable tool for key stakeholders tasked with achieving healthcare’s quadruple aim.
References
McGlynn EA. Identifying, Categorizing, and Evaluating Health Care Efficiency Measures. Final Report (prepared by the Southern California Evidence-based Practice Center—RAND Corporation, under Contract No. 282-00-0005-21). AHRQ Publication No. 08-0030. Rockville, MD: Agency for Healthcare Research and Quality; April 2008.
Shiell A, Donaldson C, Mitton C, et al. Health economic evaluation. J Epidemiol Community Health. 2002;56:85-88.
Donabedian A. Evaluating the quality of medical care. Milbank Mem Fund Q. 1966;44(3):166-206.
Donabedian A. The seven pillars of quality. Arch Pathol Lab Med. 1990;114:1115-1118.
Hollingsworth B. The measurement of efficiency and productivity of health care delivery. Health Econ. 2008;17:1107-1128. doi:10.1002/hec.1391.
Mark BA, Jones CB, Lindley L, Ozcan YA. An examination of technical efficiency, quality, and patient safety in acute care nursing units. Policy Polit Nurs Pract. 2009;10:180-186. doi:10.1177/1527154409346322.
Ozcan YA. Health Care Benchmarking and Performance Evaluation: An Assessment Using Data Envelopment Analysis. Norwell, MA: Springer; 2008.
Afriat SN. Efficiency estimation of production functions. International Economics Review. 1972;13:568-598. http://dx.doi.org/10.2307/2525845 .
Ozcan YA. Analytics and Decision Support in Health Care Operations Management, 3rd ed. Hoboken, NJ: Wiley; 2017.
Rosko MD, Chilingerian JA. Estimating hospital inefficiency: does case mix matter? J Med Syst. 1999;23(1):57-71. doi:10.1023/a:1020823612156.
Rosko MD. Measuring technical efficiency in health care organizations. J Med Syst. 1990;14:307-322. doi:10.1007/BF00993937.
Dalmau-Matarodona E, Puig-Junoy J. Market structure and hospital efficiency: evaluating potential effects of deregulation in a national health service. Review of Industrial Organization. 1998;13 447-466. www.jstor.org/stable/41798814 .
Khushalani J, Ozcan Y. Are hospitals producing quality care efficiently? An analysis using network data envelope analysis (DEA). Socio-economic Planning Sciences. 2017; 15-23. doi:10.1016/j.seps.2017.01.009
Topics
Systems Awareness
Quality Improvement
Technology Integration
Related
The Pros and Cons of Continually Assessing PerformanceIt’s Hard to Use AI as a Team. These 3 Practices Can Help.Reducing Clinical Variation Through Interdisciplinary Leadership: A Field Report from a Large Academic Medical Center