
Abstract:
In value-based payment models, payer decisions are driven by documenting disease burden and comorbid conditions annually. However, there is a lack of information on how to improve the risk adjustment factor (RAF) that is based on Hierarchical Condition Categories (HCC). Each 0 .1 of RAF has a nationally averaged valuation of $74. 85 PMPM or $898.20 PMPY. We write about our work in a Next Generation Accountable Care Organization (NGACO) aimed at improving the RAF score and HCC documentation. Combining the HCC and RAF score with other clinical or EMR-generated risk stratification scores permits targeted allocation of resources, both human and dollars, that can produce high-quality outcomes and lower costs through comprehensive case management and improved clinical work flows. Effective strategies included physician/provider and care team education, improving EMR and practice workflows to alert care teams on HCC opportunities, audit and adjudication, incentives on process measures for staff and physicians, regular feedback and reporting, use of annual wellness exams to close care gaps and document HCC, and integrating software solutions into EPIC.
Annual documentation of disease burden and coexisting conditions in a practice’s patient population is an important strategy in ensuring optimal resource allocation by payers in value-based payment models. Although several risk stratification models are available, information is lacking on how to improve upon the risk adjustment factor (RAF) that is based on Hierarchical Condition Categories (HCC) and can affect CMS payments to Medicare Advantage (MA) plans and Accountable Care Organizations (ACOs). In primary care settings, risk stratification is a relatively new concept and there is limited experience in its implementation. Operationalizing this process has not been a priority in most practices.(1) Each 0.1 of RAF has a nationally averaged valuation of $74. 85 PMPM (per member per month) or $898.20 PMPY (per member per year).(2)
In the transition from fee-for-service medicine to value-based care, it is vitally important to justify patient disease burden as a way of estimating future expenditures. Healthcare providers entering into risk-based or shared savings contracts with Medicare or other payers must pay attention to risk adjustment through HCCs, because they feature heavily in benchmark calculations. In addition to factoring capitated payments for risk-based contracts and shared savings programs, risk adjustment also is used to determine other metrics in the Merit-based Incentive Payment System (MIPS), CMS Star Ratings for acute care facilities, and case mix index.
Methods
Our impetus to use the CMS HCC method followed our enrollment in the Next Generation ACO (NGACO) Best Care Collaborative (BCC), located in Fort Myers, Florida. Given the 3% of benchmark at risk for proper documentation and reporting of HCC, our efforts during the first two years focused on driving practice workflows to obtain accurate risk scores for our population, closing care gaps, targeting chronic disease management support, and improving rates of annual wellness visits. The Best Care Collaborative NGACO partnered with Evolent Health in the second half of 2017.(1) (Evolent Health is an Operating Partner providing population health enablement services including risk stratification, care management, quality management, actuarial analysis, risk adjustment education and processing, and provider engagement.)
Between the fourth quarter of 2017 and the first quarter of 2019, our risk adjustment process leveraged Evolent Health’s suspecting engine, which generates member-specific suspected chronic conditions and also used paper forms with both clinically inferred and previously billed suspected conditions. Although not ideal, using paper patient assessment forms (PAFs) did prove to be valuable in identifying claims-based information and gave primary care providers insights into patient encounters, especially for those patients who had received care outside of our system. The use of paper PAFs filled out at the time of the visit enabled the primary care physicians, providers, and other members of the care team to explore and consider suspected conditions.
Five main factors influenced BCC’s performance: (1) provider and practice education; (2) suspected conditions; (3) reporting; (4) EMR integration in terms of operations and process improvement; and (5) incentive structure.
Provider and Practice Education
In supporting value-based contracts, primary care physicians, providers, and care teams play a central role in managing patient journeys and resource utilization. Given the existing knowledge gaps about RAF and HCC, we kicked off extensive education sessions over the first six months and continued them throughout the next three years. The focus was on the “why, what, when, where, and how.” The impact of RAF and HCC on patients, outcomes, and value to them, the medical group, and the NGACO were highlighted. Our sessions leaned on physician leadership and took a multidisciplinary approach with physicians, practice administrators, billing and coding teams, risk adjustment subject matter experts, practice managers, and the population health managers, who led the sessions. Practice groups were encouraged to compete and advance the best workflow process to incorporate the paper PAFs. In addition, the new provider orientation highlighted the ACO, care management programs, and, of course, risk adjustment and the importance of appropriate MEAT documentation (Monitoring, Evaluating, Assessing, Treating) and coding.
Evolent Suspected Conditions
Generating claims data and lists of patients, especially those patients who spent significant time away from Florida, allowed care teams to access the full patient profile. The suspected conditions targeted a stratified cohort of patients who needed additional attention and outreach, as well as longer appointments and follow-up. The risk-stratified lists of patients were extremely valuable to the practices for prioritization of patient outreach to patients with multiple chronic conditions. This helped with our HCC documentation, care coordination, and management of patients.
Reporting and Metrics
BCC used a variety of reporting tools:
Indicators of percentage of PAFs returned. In addition, Evolent Health brought monthly risk score forecasts to help guide the conversations.
Monthly RA Operations report, which provided member-level, provider-level, and practice-level data for both RA PAF metrics and claims metrics.
In year 1, the focus was on number of forms returned. In year 2, we focused more on the quality of efforts as opposed to just quantity, by reviewing how many conditions were evaluated on the PAF and not just the number of PAFs returned.
Also in year 2, our focus turned to the documentation rate. If a patient’s condition was confirmed on the PAF, did the visit note include proper documentation and result in a claim?
By analyzing these lists, we were able to target additional education and coaching sessions to the healthcare teams.
Operations and Process Improvement
Year 1 to Year 2: We built a team that met monthly and drove the questions, strategy, and operations to understand where we could improve. Another important decision was to kick off an initiative with the medical group’s coding team, to review the PAFs and validate proper documentation. The population health managers held regular meetings with each practice group, to establish relationships with the providers and staff and review their data regarding care management, utilization, quality, and risk adjustment.
A robust engagement of providers and practices participating in BCC provided a strong impetus for an EMR solution to support risk adjustment. Evolent helped vendor-driven software push data into Lee Health’s EPIC EMR through the Application Orchard. Lee Health was the first client nationally to integrate the Juxly vault risk adjustment best practice advisory (BPA) with EPIC, an innovation that our teams were responsible for creating in their search for new solutions. Juxly provides Fast Healthcare Interoperability Resources (FHIR)–based data integration between the Identifi Care Management platform and the Epic EHR. FHIR is a modern, standards-based integration technology between systems that is simpler to configure and activate.
In March of 2019, Lee Health swapped the laborious paper forms for risk adjustment and began using Juxly Vault, launched from within Epic, to capture the data electronically. Juxly provides integration between Evolent’s Identifi platform and the Epic EHR. Providers seeing patients with HCCs that have not been addressed within the past year are presented with a BPA to alert them to address those conditions. Clicking on a hyperlink within the BPA launches the Juxly Vault activity. In this activity, providers can confirm and complete MEAT documentation for a diagnosis, or reject a diagnosis. The confirmed diagnoses and MEAT documentation are filed to the Encounter diagnosis for the visit in Epic, and the codes are concurrently relayed to Identifi.
Year Two 2019: The EMR solution allowed the RA workflow to integrate seamlessly into the providers’ workflow. If a patient had unaddressed conditions, the BPA would let the physician/provider know there were outstanding conditions that needed to be addressed. Furthermore, the data flow was bidirectional. 2019 outcomes were significantly better than 2018 (Figure 1). This EMR solution was much more streamlined in the provider workflow, and helped physicians and providers impact risk adjustment and quarterback the patient’s care team more effectively and efficiently.
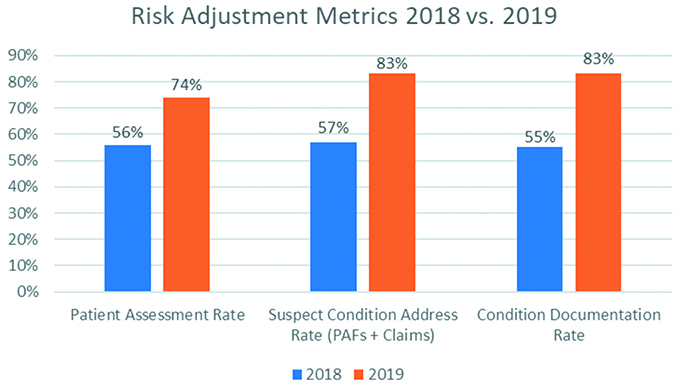
Figure 1. Risk adjustment metrics at Lee Health, Fort Myers, Florida: 2018 versus 2019. PAFs, patient assessment forms.
How do we measure success?
PAF return rate = number of patients assessed/total patients with at least one suspected diagnosis.
Suspect condition address rate = number of conditions addressed on the PAF/EMR or in claims/total suspected conditions for the attributed population.
Condition documentation rate = suspect conditions confirmed on PAF/EMR plus documented in an eligible claim/total suspect conditions confirmed on PAF/EMR. This metric is especially important where paper PAFs are used, because the provider is confirming the patient has the diagnosis on the form, but the ICD-10 code and documentation doesn’t always make it to the note/claim.
Summary: Providers are getting more patients into the office for assessments, looking at all chronic conditions that are currently affecting patients’ care, and accurately documenting them in their note as well as including them in a claim. Primary care plus EMR integration has made the providers happier and more productive, and has made our ACO successful.
Incentive Structure
We focused on: (1) getting patients in the office for their annual wellness visits; and (2) addressing all possible active conditions for each attributed patient. By giving the practice staff a metric of their own to focus on—that is, Annual Wellness Visit Completion (practice/staff incentive) and getting our providers focused on EMR integration, which enabled prompts regarding HCC gaps and coding/documentation alerts (provider incentives), we have been able to work together and drive both key levers (e.g., RAF scoring, care gap closure, documentation) and improve outcomes.
There were barriers and unexpected challenges to overcome. The biggest obstacle we faced in the NGACO program for risk adjustment was CMS/CMMI methodology changes, which came in the middle of the performance year. Two important changes that made the program challenging were:
Baseline year changes: changed from a stagnant baseline year to a 2-year rolling baseline; and.
Risk score cap calculation. Prior year scores get inflated by normalization rather than decreasing current year risk score.
Lastly, to ensure the integrity of the Program, the BCC compliance team is playing an important role in ensuring our success in risk adjustment by auditing risk adjustment workflows as implemented. Audit results also are validated by an outside vendor, who reviews the providers’ selections during the RA encounter and dates of services compared with documentation and what went out on the claim. Audit results will be used to direct our educational content.
Discussion and Literature Review
Risk-based contracting in alternative payment models and Medicare Advantage plans allow for patient level risk score adjustments by appropriately capturing chronic conditions, which ensures more accurate payments to care for the patients. Appropriate risk scores can help practice redesign that advances quality through closed care gaps and better utilization to lower costs of care. Mandal et al.(2) note that each 0.1 of RAF has a nationally averaged valuation of $74. 85 PMPM, or $898.20 PMPY.
Mandal et al. involved an HCC physician champion to drive better HCC documentation coding as well as to develop cost-effective care redesign for patients with diabetes and its complications. By auditing charts for gaps in documentation and HCC coding, they targeted one-on-one mentoring and education of those physicians who scored below the 50th percentile.
This approach allowed the intervention group to increase its RAF by 4.1% (score of 1.0 raised to 1.041), which generated an additional $2,519,544 per 1000 intervention group members. With practice redesign and outreach to close care gaps, office visits increased, adding $258,334.00 per 1000 members. Emergency department visits declined by 11.2% ($100,915 in savings), and in-patient admissions dropped 11.9% ($1,756,869 in savings). Their study also found a survival benefit of 6% in the intervention group.
The CMS implemented the hierarchical condition category (CMS-HCC) model in 2004.(3) This model initially was employed by CMS to adjust capitation payments to Medicare Advantage plans but is now used to calculate expenditure benchmarks for Medicare ACOs as well.(4) The HCC model “risk adjusts” patients based on diagnosis codes submitted on claims during the preceding 12-month calendar year. The RAF is used to estimate future medical expenditures and to adjust per member per month (PMPM) payments to ACOs.
To determine risk adjustment, ICD-10 diagnosis codes are divided into condition categories, then listed in each category hierarchically based on severity of illness for HCCs. The payment model also excludes HCCs that do not (empirically) substantially add to costs.(5)
The principles(6) of the HCC-CMS diagnostic classification system were to:
Be clinically meaningful;
Predict medical expenditures;
Have adequate sample sizes to validate savings and estimates accurately;
Characterize a person’s illness level within each disease process;
Encourage specific coding and not reward coding proliferation;
Avoid penalties for recording additional diagnoses;
Be internally consistent. (e.g., if A ranks higher in HCC and B is higher than C, then A should be higher than C);
Assign all ICD-9 CM codes; and
Exclude discretionary diagnostic categories from payment models to decrease coding variations, coding proliferation, and gaming and upcoding.
There are challenges, however, in working with the HCC. Sorace et al.(7) point to complications when dealing with myriad clinical conditions that interfere with addressing issues of mortality and morbidity. They note in their study of disease combinations) with HCC CMS model that 60% of beneficiaries and 16% of total expenditures were attributed to beneficiaries who had either no HCC or one of 70 disease combinations described by a single HCC. Patients in this category could be helped with prevention strategies and single disease management tactics.
Risk stratification calls for tiering patient populations on the basis of presence of health and social factors to optimize health outcomes and decrease the total cost of care through avoidance and prevention.
Multiple diagnoses and comorbid conditions make generalizations about expenditures and clinical care for a patient difficult. None of the three tested methods (prevalent HCC, disease interaction HCC, low complexity disease combination) identified a subset of disease combinations that accounted for a majority of expenditures.
In a scoping review, Steenkamer et al.(8) searched to find the current state of knowledge in population health management. They found that population health management activities in most studies included population identification, Triple Aim assessment, risk stratification, interventions that included disease management programs, preventive services and health promotion, monitoring and evaluation methods, and quality improvement processes. They concluded that lack of uniformity and varied “interpretations and conceptualizations of population health management” is a barrier to comparing effective strategies and steps to achieve the Triple Aim.
Risk stratification calls for tiering patient populations on the basis of presence of health and social factors to optimize health outcomes and decrease the total cost of care through avoidance and prevention. Finison et al.(1) report that risk stratification allows healthcare teams to focus available resources on the patient’s needs and target appropriate care and assistance to cohorts with multiple complex challenges and burden of health and social determinants, the groups that disproportionately account for overall healthcare costs and utilization. These aims are highlighted in the ACO and state-level activities that target quality and lower costs. Without risk stratification for high-risk and rising-risk patients, assigning high-cost interventions, such as intense case management or transportation for example, will be futile.
The CMS HCC model is not the agent of choice for risk stratification when compared with other available tools.(9,10)
In studying the economic profiling that health insurance companies use to compare costs and “tier” physicians and encourage improvements in healthcare utilization and costs, Thomas et al.(9) compared six risk adjustment systems:
Adjusted Clinical Group System (Johns Hopkins University);
Burden of Illness Score (MeDecision Inc.);
Clinical Complexity Index (CCI; Solucient LLC);
Diagnostic Cost Groups, using the HCC model;
Episode Risk Groups (Symmetry Health Data System); and
General Diagnostic Group (GDG).
They found the CCI methodology produced least accurate estimates, and GDG had the most accurate estimates. They found that these data sets could be used as an incentive for patients to use a physician or practice in the lower-cost tier through lower deductibles or copays. Fidelity was challenged by coding errors that can tarnish claims data, as can attribution of patients to a physician.
Haas et al.,(10) concerned with uncoordinated, redundant, duplicative services that drive utilization and costs along with increased risk of admission to an inpatient bed or emergency department visit, compared six common risk adjustment methods in predicting hospitalizations, emergency department visits, 30-day readmission, and high expenditures that could help drive better case management and coordination directed to risk-stratified patient segments. The models they compared were:
Adjusted Clinical Group (Johns Hopkins University);
HCC;
Elder Risk Assessment Home Tiering;
Chronic Comorbidity Count (CCC);
Charlson Comorbidity Index (CCI); and
Minnesota Healthcare Home Tiering.
Their study population consisted of 83,187 patients above 18 years of age from the employee and community health practice, a large integrated multidisciplinary group practice at Mayo Clinic in Rochester, Minnesota. They found that the Adjusted Clinical Group model was best in predicting hospitalizations, with Elder Risk Assessment Home Tiering and Minnesota Healthcare Home Tiering coming next. The Adjusted Clinical Group model also was very good at predicting 30-day readmissions. In their analysis, the CMS HCC method had the lowest predictive ability for all four measures: hospitalizations; readmission; emergency department visits; and cost.
They also found significant overlap in the risk stratification methods.
In a study of their ACO, Egan et al.(11) found that 28% of adults are burdened with three or more chronic conditions. Congestive heart failure and chronic kidney disease affected 23% of beneficiaries with comorbid conditions. Hypertension and lipid disorders were most prevalent, followed by cardiovascular disease, osteoarthritis, and obesity.
A full-time primary care doctor would have to commit 21.7 hours per day to follow all recommended care guidelines and “10 hours for the 10 most common chronic conditions.” By stratifying and narrowing groups of patients with multiple chronic conditions that account disproportionately for higher costs, and using HCCs, they concluded that stratification and HCC may help adoption of integrated guidelines and resources guiding efficient, comprehensive case management toward better quality and lower costs.
Moving away from payer-initiated healthcare management incentives, Xu et al.,(12) at the Morehouse Healthcare Comprehensive Family Healthcare Center, wanted to empower practices to define and manage their own patient panels in a payer-agnostic manner to advance population health management. Thirty-five percent of their patient panels had at least two comorbid chronic conditions.
By using a risk stratification algorithm that relied on diagnostic codes, they found a group of high-risk patients who received care management with a nurse care manager, community health worker, licensed clinical social worker (LCSW), physician, and community support liaison. The most commonly coexisting conditions in their cohort were hypertension and hyperlipidemia.
They found that a multidisciplinary team working with high-risk patients and data available in the EHR within the practices and in the communities was a good low-cost and scalable option.
Wagner et al.(13) looked at 37 practices across Oregon, Colorado, and Kentucky. Practices used automated algorithms with manual or hybrid methods to assign risk scores to patients and to redesign care workflows (e.g. triaging high-risk patients, referrals to care managers or extended appointment visits). Some of their challenges in this redesign was the time it took to risk-stratify panels, embedding the changes into existing protocols and the burden of integrating with an EHR. They suggest optimizing automation, with human review use of a color-coded patient record banner to alert everyone on the care team to high-risk patients. They also incorporated an adjudication process that let clinicians incorporate missed items from patient history and social determinants into assigning risk.
Finison et al.(1) combined Medicare and Medicaid populations in Vermont into a single whole population measurement system. They worked with 283,153 adult and 78,162 pediatric patients in the Blueprint program, with practice profiles that included 27 expenditures, 15 utilizations, 10 HEDIS, and 5 additional National Quality Forum endorsed measures. Their findings suggest that a more complete risk adjustment model is appropriate for all-payer, “whole population” analytics when comparing outcomes at the practice level. These patient profiles can then drive engagement and data driven decisions that impact quality and care coordination across a Health Service Area.
Summary and Conclusion
Risk stratification and documentation of patient disease burden is a key strategy to success in any value-based transformation. Participating in a NGACO requires using the CMS HCC model to help document disease burden, achieve optimal benchmarking, and maximize potential shared savings. Although it is not ideal, combining the HCC score with other clinical or EMR-generated risk stratification scores allows for targeted comprehensive case management, follow-up, improved clinical work flow, closure of care gaps, and annual wellness exams, all of which then drive high-quality outcomes and lower utilization and costs among patients stratified to a high risk or rising risk category. This, in turn, affects emergency department visits, rates of primary care office visits, readmissions and admissions, admit rates for ambulatory case-sensitive conditions, and disease prevention.
The following steps will help healthcare teams maximize their potential shared savings under an NGACO and also may apply to other alternative payment models in risk-based contracts:
Use of a risk stratification tool and score;
Education on RAF and HCC of physicians and providers;
EMR or paper or hybrid tool to document chronic conditions and assess the presence or absence of conditions;
Integration of software solutions into the EMR (e.g., the Juxly Vault risk adjustment BPA with Epic);
Medicare annual wellness visits;
Alignment of physician compensation and incentives;
Regular staff and physician meetings to provide updates and feedback and share best practices;
Audit and adjudication processes to document historical information and social determinants;
Redesign of care and visit workflows from appointment times to reminder alerts; and
Use of a multidisciplinary team working both within the organization (internal) and outside the organization (external) agencies.
References
Finison K, Mohlman MK, Jones C, et al. Risk adjustment methods for all-payer comparative performance reporting in Vermont. BMC Health Serv Res. 2017;17:58. DOI:10.1186/s12913-017-2010-0.
Mandal AK, Tagomori GK, Felix RV, Howell SC. Value-based contracting innovated Medicare Advantage healthcare delivery and improved survival. Am J Manag Care. 2017;23:2: e41-e49.
Pope GC, Kautter J, Ellis RP, et al. Risk adjustment of Medicare capitation payments using the CMS-HCC model. Health Care Finance Rev. 2004;25:119-141.
Yeatts JP, Sangvai DG. HCC Coding, risk adjustment, and physician income: what you need to know. Fam Pract Manag. 2016;23(5):24-27.
Report To Congress: Risk Adjustment In Medicare Advantage. December 2018. https://www.cms.gov/Medicare/Health-Plans/MedicareAdvtgSpecRateStats/Downloads/RTC-Dec2018.pdf .
Pope GC, Kautter J, Ellis RP, et al. Risk adjustment of Medicare capitation payments using the CMS-HCC model. Health Care Financing Review. 2004;25(4).
Sorace J, Wong H-H, Worrall C, Kelman J, Saneinejad S, MaCurdy T. The complexity of disease combinations in the Medicare population. Popul Health Manag. 2011;14(4):161-166.
Steenkamer B Mm, Drewes HW, Heijink R, Baan CA. Strujis JN. Defining population health management: a scoping review of the literature. Population Health Management. 2017;20(1).
Thomas JW, Grazier KL, Ward K. Comparing accuracy of risk adjustment methodologies used in economic profiling of physicians. Inquiry. 2004;41:218-231.
Haas LR, Takahashi PY, Shah ND, et al. Risk-stratification methods for identifying patients for care coordination. Am J Manag Care. 2013;19(9).
Egan BM, Sutherland SE, Tilkemeier PL, Davis RA, Rutledge V, Sinopoli A. A cluster-based approach for integrating clinical management of Medicare beneficiaries with multiple chronic conditions. PLOS ONE. 2019; June 19. DOI:org.1371/journal.pone.0217696.
Xu J, Williams-Livingston A, Gaglioti A, McCallister C, Rust G. A practical risk stratification approach for implementing a primary care chronic disease management program in an underserved community. J Health Care Poor Underserved. 2018;29:202-213. DOI:10.1353/hpu.2018.0014.
Wagner J, Hall JD, Ross RL, et al. Implementing risk stratification in primary care: challenges and strategies. J Am Board Fam Med. 2019;32:585-595. DOI:10.3122/jabfm.2019.04.180341.